

The Margin of Error
In the run-up to the November 7th election, the major pollsters had headline results showing a very tight race—in some cases a virtual tie. However, when the votes were counted, the President was handily re-elected. In fact, the results were all within the margin of error of most polling leading up to the election. Of course, you couldn't tell that anyone at the major media outlets was paying attention to the margin of error by watching your television network of choice.
The results are in and the questions are over, right? Not hardly.
Washington, DC looks much like it did before November 7th: a Democratic White House, a Republican House, and a Democratic Senate. When it comes to the economy, we are right back to where we have been for the last five years. Markets are still sloughing off one of the biggest benders on record, with investors still licking their wounds. GDP growth rates in the United States dance around the 2% mark, with each revision on either side causing a sell-off or rally in the stock market. The NFIB Small Business Optimism Index, while rising slightly, is still down at recession levels.
Two important statistics—asset correlations and birth rates—might also give us another indication of how both the "market" and "individuals" are thinking about the economy.
Starting with asset correlations, the graph below tracks several asset classes from 1997 to present and compares them to the Russell 2000® Index. These recent trends confirm what academic research has long since proven: in times of stress, correlations among risky assets generally rise. This, we suspect, is why a large number of hedge funds have not been able to deliver on their goals of "uncorrelated returns."
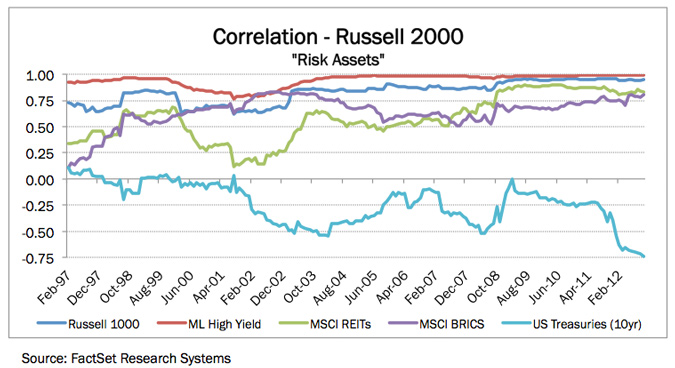
This chart below paints the picture of fear. Money flows from risky assets to perceived safety, occasionally paying for the privilege along the way. We noted in our last commentary that high-yield bond issuance with limited covenant protection was on pace for a record year. Issuance this year has now surpassed the record year of 2010, with the category of leveraged recaps high on the menu. Private companies (and some public companies) will often use this device to borrow money, which they then dividend to themselves, at attractive tax rates. Also, owners of companies are highly incented to sell before capital gains rates go up next year. Investors, in their frantic search for yield, are all too happy to oblige them. Sound familiar?

Let's turn our attention to the second statistic: birth rates, which have been on a long-term decline in the United States. Since 2000, US birthrates had stabilized, and had been actually climbing. However, since 2007, rates have been falling again—by nine percent in the past three years alone. Additionally, according to Google Trends, the share of search volume for the term "preschool" has been declining for the past several years. This makes sense given lower birth rates.
The implications for both statistics will be far reaching into the future. Until the market begins to feel comfortable taking risk of any kind, we should expect low interest rates and meager growth. It is too difficult to predict when these trends will reverse. Pessimism can be viral and persistent, making it difficult for the economy to climb out of its misery.
The point of all of this is to say that the market, and other indicators, is telling us that there is still no sure sign of optimism anywhere. When this happens, we can expect correlations to remain high and volumes to remain low, which is exactly what took place in the third quarter of this year.
All of this pessimism has its own margin of error. It results in dramatically shortened investment horizons, putting longer duration assets such as small company stocks at significant discounts to their intrinsic values. This gives investors like us exciting new opportunities that our team plans to leverage on behalf of our clients, generating our own unique brand of optimism.
Sincerely,
Pacific Ridge Capital Partners
About Pacific Ridge Capital Partners
Pacific Ridge Capital Partners is an employee-owned firm. We generate our own investment ideas using fundamental analysis and bottom-up stock picking. The investment team applies a consistent, patient and disciplined process that results in low turnover and stability. Our proven philosophy has performed well over many investment cycles and it is the consistent application of this strategy that makes Pacific Ridge unique.
The principals of Pacific Ridge Capital Partners are invested along with our clients in each of our strategies.
PRCP Small Cap Value – Our Small Cap Value strategy generally purchases stocks in the bottom three-quarters of the Russell 2000® Index. This smaller capitalization segment has a large number of underfollowed companies, providing us the greatest opportunity to exploit market inefficiencies. The typical range of holdings is between 100 and 150.
PRCP Micro Cap Value – Our Micro Cap Value strategy generally purchases stocks in the Russell Microcap® Index. This segment is widely underfollowed, providing us the greatest opportunity to exploit market inefficiencies. The typical range of holdings is between 50 and 80.
We believe these market cap segments offer great potential returns and additional diversification for our clients. For further information about Pacific Ridge Capital Partners and our investment strat- egies, we invite you to contact Tammy Wood via email at Tammy.Wood@PacificRidgeCapital or by phone at (503) 878-8502.
Disclosures
Pacific Ridge Capital Partners, LLC (“Pacific Ridge”, “PRCP”, or “the Firm”) is an employee-owned investment advisor registered with the Securities and Exchange Commission under the Investment Advisor Act of 1940. The Firm was established in June 2010, and has one office located in Lake Oswego, Oregon. Pacific Ridge claims compliance with the Global Investment Performance Standards (GIPS®).
Sources: Pacific Ridge; FactSet Research Systems (“FactSet”); and Russell Investment Group (“Russell”) who is the source and owner of the Russell Index data.
The current annual investment advisory fees for the portfolios managed in the Firm’s Small and Micro Cap Value strategies are 1.00% and 1.50% of assets, respectively. Returns for the composites are presented gross and net of management fees and other expenses and includes realized and unrealized gains and losses, cash and cash equivalents and related interest income, and accrued based dividends. The Firm calculates time weighted rates of return by geometrically linking portfolio simple rates of return at least monthly, with adjustments made for significant external cash flows. The composite returns are calculated by asset weighting the individual portfolio returns using beginning of the period values. All returns are calculated after the deduction of the actual trading expenses incurred during the period.
The information provided should not be considered a recommendation to purchase or sell any particular security. There is no assurance that any securities discussed herein will remain in our strategy at the time you receive this report or that securities sold have not been repurchased. It should not be assumed that any of the holdings discussed herein were or will be profitable or that the investment recommendations or decisions we make in the future will be profitable or will equal the investment performance of the securities discussed herein. Past performance is no guarantee of future results.
Although the statements of fact and data in this report have been obtained from, and are based upon, sources that the Firm believes to be reliable, we do not guarantee their accuracy, and any such information may be incomplete or condensed. All opinions included in this report constitute the Firm’s judgment as of the date of this report and are subject to change without notice. This report is for informational purposes only and is not intended as an offer or solicitation with respect to the purchase or sale of any security.
The Russell 2000® Value Index measures the performance of the Russell 2000 companies with lower price-to-book ratios and lower forecasted growth values. For comparison purposes, the index is fully invested, which includes the reinvestment of income. The return for the index does not include any transaction costs, management fees or other costs.
The Russell Microcap® Value Index measures the performance of the microcap segment of the U.S. equity market. For comparison purposes, the index is fully invested, which includes the reinvestment of income. The return for the index does not include any transaction costs, management fees or other costs.
Returns and asset values are stated in US dollars.