
Small Cap Value Investing in a Rising Interest Rate Environment
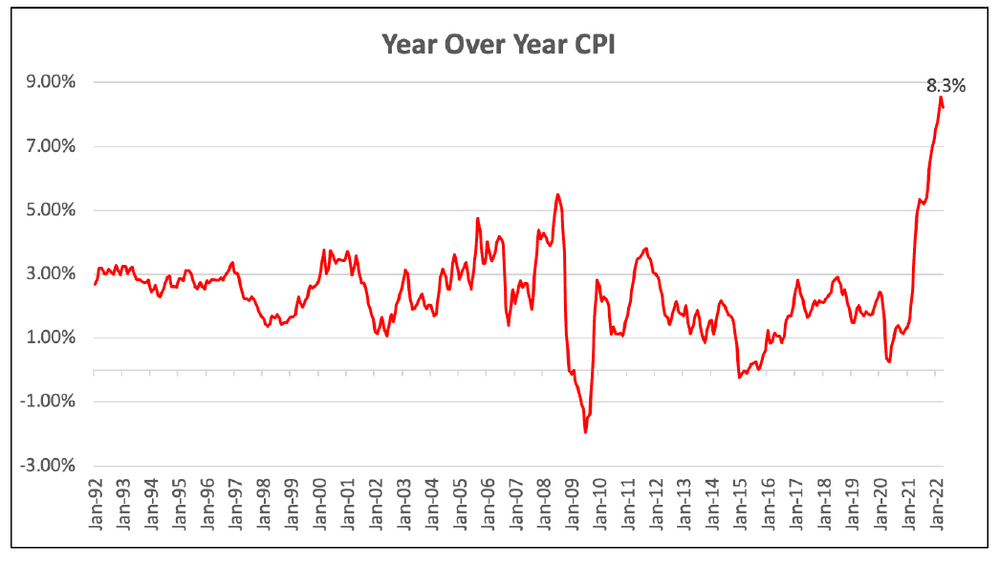
Inflation has been foremost on investors’ minds during this recent period of stock market volatility. Having run below 4.0% for the past 30 years, inflation rose to 8.3% for the twelve-month period ending April 30, 2022. The reasons for this increase have been well publicized: A spike in oil prices caused by the prolonged war between Ukraine and Russia, a rise in consumer demand and supply chain disruptions due to the Covid lockdown in China.
For its part, the Fed has been doing its best to stem inflation in order to maintain price stability and full employment. Since the beginning of 2022, they have raised the benchmark interest rate twice: 25 basis points in March and 50 basis points in May. Fed Chair Jerome Powell stated that additional 50 basis point hikes are on the table when the central bank meets in June and July.
The spread between the 3-month Treasury bill and the 10-year Treasury yield curve is often used as a barometer to measure future inflation expectations and investor confidence. Investors use this delta to forecast how individual segments of the stock market may perform in various yield curve scenarios. A widening spread creates a positive yield curve, indicating future economic stability. A narrowing spread can suggest worsening economic conditions.
On May 6, 2022, the delta between the Treasury bill and the Treasury yield curve was 2.3%, higher than its long-term average of 1.2%. At Pacific Ridge Capital Partners, we interpret that figure to mean that small cap value stocks are an excellent investment strategy during a rising interest rate and rising yield curve environment. Here is our reasoning.

Recent interest rates hikes have clearly served to “de-risk” investor appetites, penalizing both size and style in the overall equity market. This has led to a significant correction in growth stocks this year compared to value stocks. Within the small cap universe, the Russell 2000 Growth Index is down -27.0%, while the Russell 2000 Value Index is down -7.5% (year-to-date through May 25, 2022). The difference is a staggering 1,681 basis points.
One reason for this significant correction in growth stocks can be traced to their valuations. Rising interest rates cause the valuation of growth stocks to decline because their perceived future cash flows are not worth as much as near-term cash flows for value stocks.
This hypothesis is supported by a 2019 study from Northern Trust that uses Fama-French data collected from December 1977 to October 2018. The data shows that in a rising interest rate environment and a yield curve that is either flattening or steepening, smaller-sized and value-style companies tend to outperform other US equities when economic growth prospects are slowing or gradually improving. A second study by Fama-French concludes that over longer time horizons (1926-2022), smaller-sized companies outperform larger-sized companies. Though the data in the past ten-year period seems to contradict this trend (larger-sized companies outperformed smaller-sized companies), in actuality, big tech stocks in the Russell 1000® index have risen disproportionately higher than smaller companies, skewing the data. During the past decade, small cap value stocks continued to be undervalued compared to growth stocks, making them a better investment option during periods of high inflation.

The huge return differentials between small value and growth is clear: Valuations for small cap value stocks are near generational lows. Consider these current Price/Book (P/B) ratios:
Russell 2000 Value Index: 1.6x
Russell 2000 Growth: 4.0x
Russell 1000 Growth: 11.2x
Additionally, the Price/Earnings (P/E) ratios for small cap value are 20% lower than their historical average, and 30% lower than the larger companies. Consider these current P/E ratios:
Russell 2000 Value Index: 12.2x
Russell 2000 Growth: 17.8x
Russell 1000 Growth: 26.5x
The table below shows size and style valuation comparisons and clearly indicates that small cap value (Russell 2000© Value Index) has the lowest valuation (lowest P/B and lowest P/E).

Finally, the chart below shows the historical median valuation of small cap growth portfolios and small cap value portfolios, as measured by Evestment. The data confirms that valuations are nearing generational lows.

We think the timing couldn’t be better for small-cap value stocks because they are undervalued, they possess strong cash flows, their growth is healthy and they have lower valuations compared to the other US equity classes. At Pacific Ridge, we are not worried about the quarter-to-quarter fluctuations of stock prices, and we understand that riding the volatility wave is a necessary component of investment management. No matter what the short-term economic and market trends may be, we remain steadfast in our core mission: Invest in good companies at attractive prices.
Sincerely,
Pacific Ridge Capital Partners