

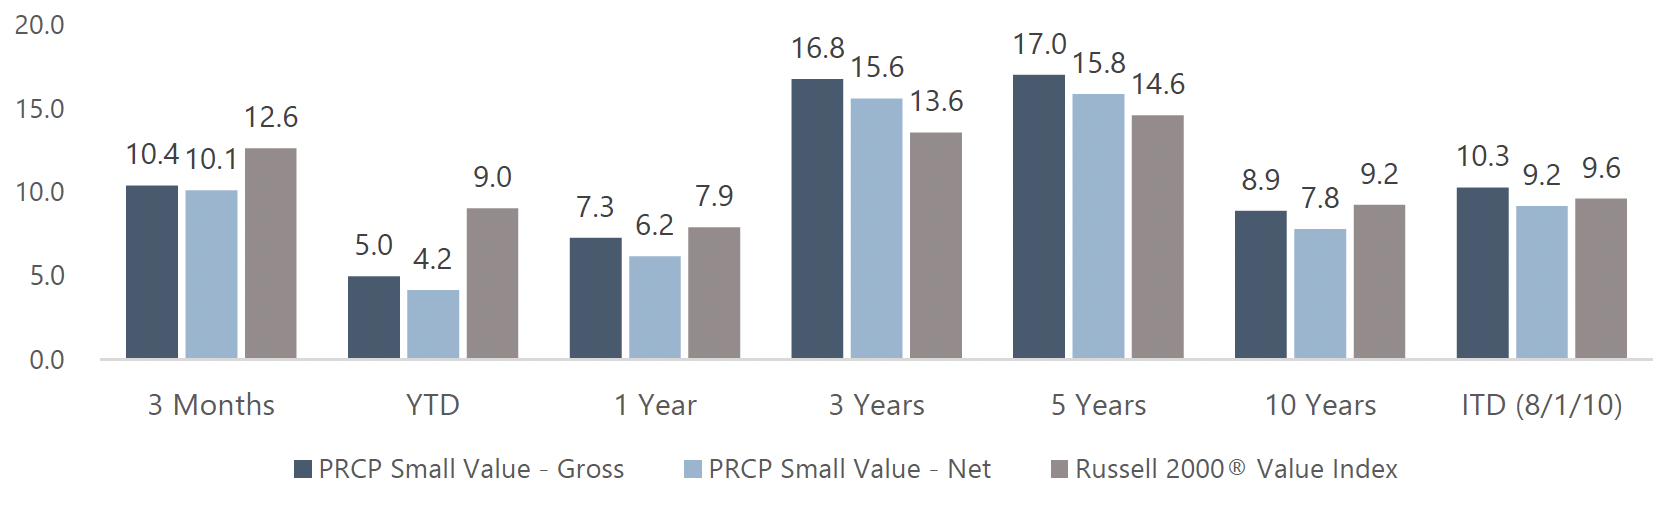
Performance Review
The Pacific Ridge Capital Partners Small Cap Value Strategy (the “Strategy”) returned 10.4* (10.1%* net of fees) for the quarter ended September 30, 2025, underperforming the Russell 2000® Value Index (the “Index”) return of 12.6%. For the trailing twelve-month period, the Strategy returned 7.3%* (6.2%* net of fees), underperforming the Index return of 7.9%.
Size Analysis
During the quarter, the Strategy benefited from a modest tailwind related to its size bias, as smaller companies outperformed their larger counterparts within the Index. Companies with market capitalizations below the Index median returned 14.7%, compared to a 12.3% return for those above the median. The Index held just 14.0% of its weight in companies below the median, while the Strategy maintained a significantly larger allocation at 38.2%.

*Preliminary results. For additional performance information, see the related GIPS® Report on page 6.
**The size breakpoint in the chart is based on the Index’s median market capitalization at the beginning of the period.
The Strategy’s portfolio characteristics may differ significantly from those of the Index because we primarily invest in smaller, undervalued stocks and adopt a sector-agnostic approach. You can see these distinctions in the charts above and on the following pages.
Style Analysis
The Strategy’s emphasis on profitable companies was a significant headwind in the third quarter, much like it was in the second quarter. Unprofitable companies (P/E <0x) posted large gains again (32.6% vs. 12.6% for the Index), dwarfing the performance of stocks with positive earnings, which generated high single-digit returns within the Index and low double-digit returns in the Strategy.

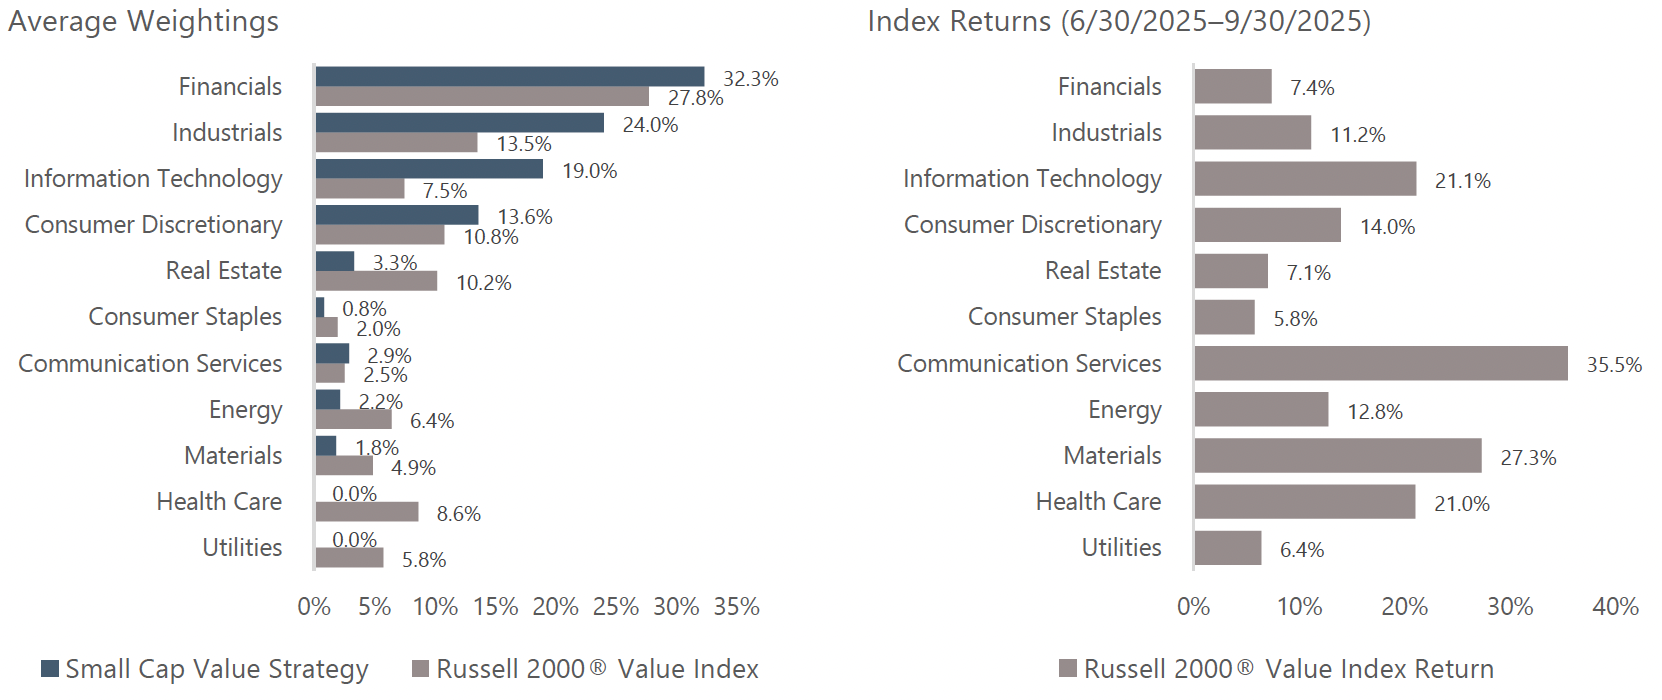
Sector Analysis
The two top contributing sectors to the Strategy’s performance for the quarter were the Consumer Discretionary and Utilities sectors. Consumer Discretionary was additive mostly due to the Strategy’s holdings outperforming the Index’s holdings in the sector. The Strategy has no exposure to Utilities, and Utilities significantly underperformed the overall Index. Conversely, the two sectors that most negatively impacted the Strategy’s performance were Materials and Industrials. Materials was a strong performing sector in the Index; however, the Strategy had an underweight to Materials in addition to holding weaker performing stocks within the sector. Industrials detracted from performance due to the Strategy’s overweight in the underperforming sector, again combined with subpar stock selection scores.
*P/E ratios are based on analyst estimates for the current fiscal year, including both completed and estimated quarterly results. Companies that have no earnings estimates have been excluded, and thus the bars may not add up to 100%.
The Strategy’s portfolio characteristics may differ significantly from those of the Index because we primarily invest in smaller, undervalued stocks and adopt a sector-agnostic approach.
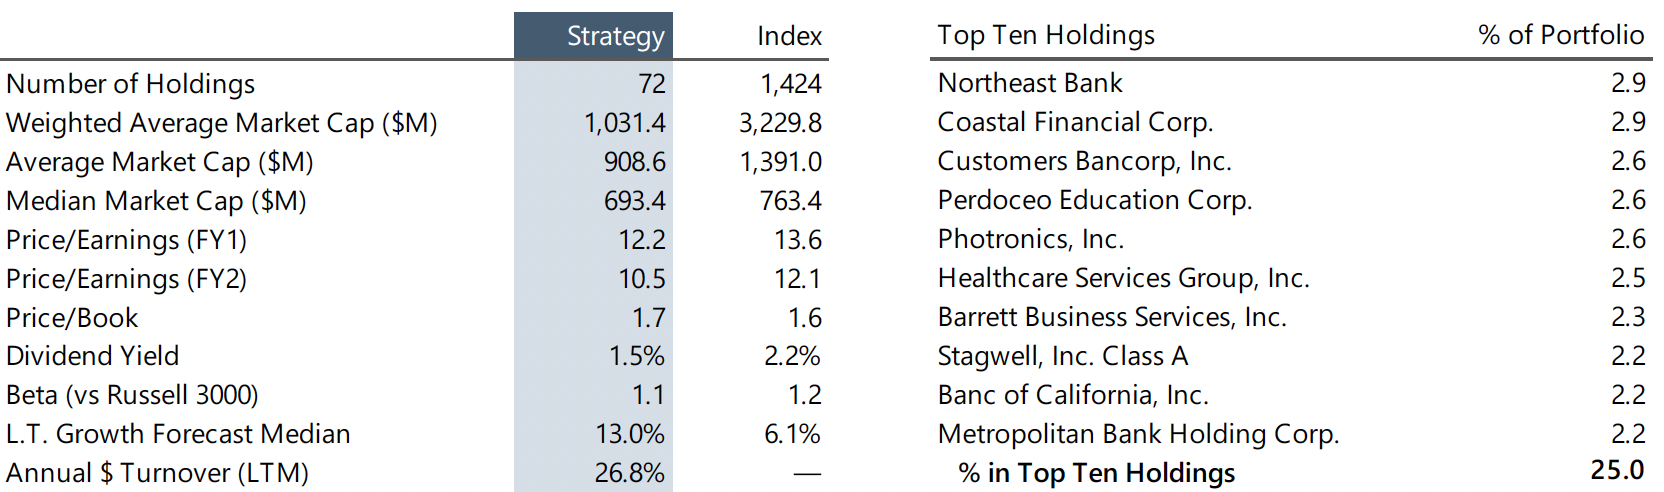
Portfolio Characteristics
Top Contributors
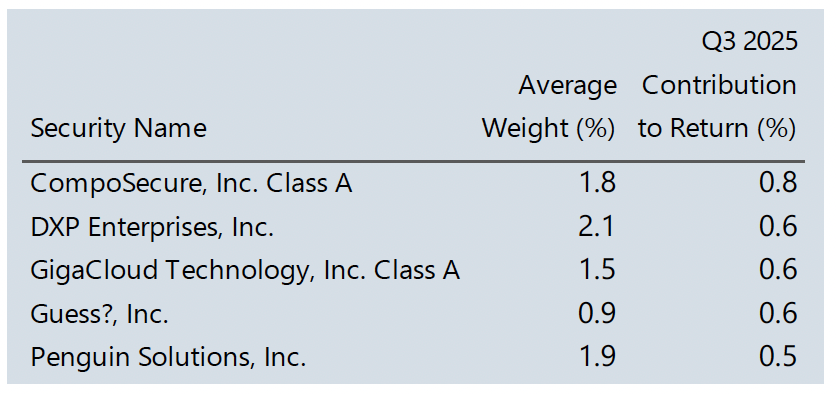
CompoSecure (“CMPO”) is the primary maker of metallic and other unique credit cards, with long-term relationships with all of the major issuing banks. CMPO’s share price rose during the quarter due to the company’s recent strong financial results and favorable outlook. The results and outlook were driven by a combination of strong growth in, and efficiencies from, new high-end credit card programs, and a reduction in drag from the slow turn to profitability in CMPO’s Arculus security/authentication unit. The market is excited about changes in ownership and management, plus the potential for M&A growth, while we are most pleased with the company’s demonstrated organic growth and improvements in profit margins.
DXP Enterprises (“DXPE”), a distributor of maintenance, repair, and operations (MRO) products and services with a particular focus on pumps and rotating equipment, reported another quarter of sales and earnings growth driven by strong demand for innovative pump packages and contributions from acquisitions. Despite increased automation-related investments, the company continues to generate significant free cash flow to support its growth strategy and expects to close several more deals before year-end that will help drive earnings higher.
GigaCloud Technology (“GCT”) runs a B2B logistics marketplace linking Asian manufacturers to US and European retailers, particularly those dealing in large home furnishings and other bulky goods. After share prices dropped earlier in the year due to tariff headlines, the stock performed well in the third quarter, as GCT continued to post solid results and cash flow. The company is also expanding its European footprint, particularly in Germany, to reduce US end-market concentration. While tariffs have moderated our growth outlook for the company, margins remain healthy and the shares trade at a notable discount relative to our target value.
Guess? (“GES”), a designer and marketer of clothing and accessories, announced an agreement to go private in a deal with Authentic Brands Group for $16.75/share in cash. This is a nice premium over a previous proposal it received from WHP Global at $13/share. With shares trading at the deal price and a high likelihood of the deal closing, we took the opportunity to exit our position.
Penguin Solutions (“PENG”), formerly known as SMART Global Holdings, has three distinct business segments: technology consulting and solutions services, specifically with an AI focus; specialty high-performance computer memory solutions; and Cree LED lighting. PENG has begun to attract the market attention we expected, after simplifying its business and improving its balance sheet. The core consulting, memory, and solutions businesses have seen rapid growth, albeit with lumpiness caused by sales to one large hyperscaler customer that has caused volatility and opportunities in the stock. We expect growth and multiple expansion to continue, with an eventual likely divestiture of Cree.
Top Detractors
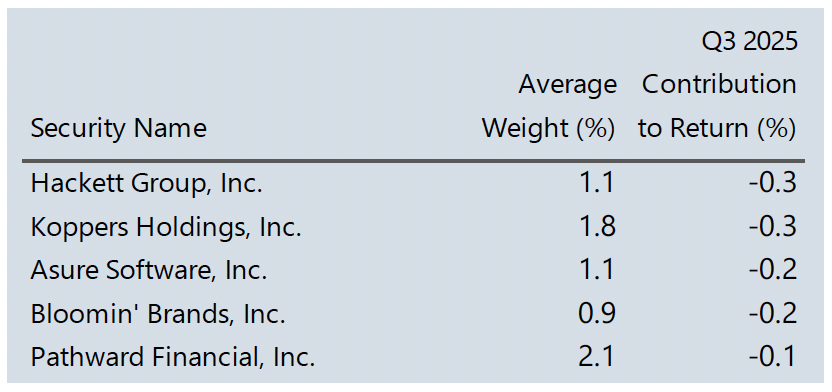
Hackett Group (“HCKT”) provides technology-focused management consulting and software implementation services, with a strong reputation for its benchmarking data. The company disappointed the market recently with a weaker than expected outlook, primarily owing to softness in its Oracle ERP implementations practice. However, management remains very enthusiastic about the company’s products and service offerings in the generative AI space and related partnerships with other promising players in that market. Generative AI is a high-margin opportunity for HCKT, but as recent research has highlighted, we are in the very early stages of realized efficiencies from AI.
Koppers Holdings (“KOP”) supplies treated wood products, wood-treatment chemicals, and carbon materials used in railroad ties, utility poles, and industrial applications. KOP shares underperformed this quarter after the company missed 2Q25 expectations and cut its 2025 outlook, citing sluggish demand across market segments. While the business is not immune to cyclical swings, management has demonstrated an ability to weather them. With shares trading at a sizable discount to our implied value, we took advantage of the stock’s current discounted rate and increased the Strategy’s weight in KOP.
Asure Software (“ASUR”) is a payroll services and human resources software provider that primarily focuses on small- to medium-sized businesses but has been increasingly targeting larger enterprises. The company reported third-quarter results slightly below expectations but increased full-year guidance. They also completed the acquisition of an attractive and growing time and attendance software company during the quarter, which should create cross-selling opportunities, but also came at a premium valuation. Management has a history of meeting expectations inconsistently, so the market appears to be taking a wait-and-see approach for the moment.
Bloomin’ Brands (“BLMN”) is a casual dining restaurant group, including Outback Steakhouse, Carrabba’s Italian Grill, and Bonefish Grill. BLMN has seen challenges recently around higher labor and food costs, especially beef. While peers face the same issues, Outback Steakhouse has been hit especially hard, struggling to find the middle ground between resonance with value-seeking customers and reasonable profit margins. As a result, BLMN shares are trading at a very low valuation, so we are looking for an upward turn, or at least a bottoming, to begin to unlock this opportunity.
Pathward Financial (“CASH”) is a specialized bank that provides unique lending verticals through its banking as a service (BaaS) segment. The bank has grown and diversified their business significantly over the years, forming relationships with numerous operators in the fintech space. CASH shares were modestly down for the third quarter following price increases during the first half of the year. We remain optimistic about this stock, as Pathward remains highly profitable and trades at an attractive multiple on earnings.
Market Review and Outlook
The third quarter of 2025 is best characterized as a period of euphoria tempered by concerns over future growth. The Federal Reserve resumed cutting interest rates in September in an attempt to support the weakening labor market amid continued uncertainty surrounding trade policy. Equity markets performed very well, with the S&P 500 and Nasdaq rallying by 8.1% and 11.4%, respectively. AI stocks continued to perform very well, as numerous partnerships and investments in that space were announced during the quarter.
Offsetting the strength in the US market were concerns about the looming government shutdown and delays in economic data releases due to turnover in personnel at the Bureau of Labor Statistics (BLS). Escalating trade tensions with China over technology exports also warrant close monitoring. A strong earnings season with 81% of S&P 500 companies exceeding expectations proved to be a key driver of stock performance.
While economic data points towards market resilience, labor indicators show clear signs of weakness. GDP for the first half of 2025 was under 2%, while the unemployment rate ticked higher and monthly nonfarm payroll growth is slowed significantly. Inflation readings are modest but still meaningfully above the Fed’s 2% target. President Trump has called for additional rate cuts to help fuel growth, though this risks driving inflation higher over the long term, putting Federal Reserve Chairman Powell in a very difficult position.
If there is further economic deterioration, we are more concerned about the depth and duration of the downturn rather than the technical declaration of a recession or its timing. Massive investments in AI infrastructure have amplified the risk of a bubble, harkening back to the dot-com era. Warning cracks in private credit are appearing as well: older vintage deals are seeing rising defaults, and widening spreads indicate strains in direct lending as well as higher borrowing costs.
We will continue to focus on finding attractive companies with superior risk-adjusted returns in the Small and Micro Cap Value universe, targeting firms with strong balance sheets and track records of free cash flow generation.
Other Professionals
Investment Team


PRCP GIPS Report
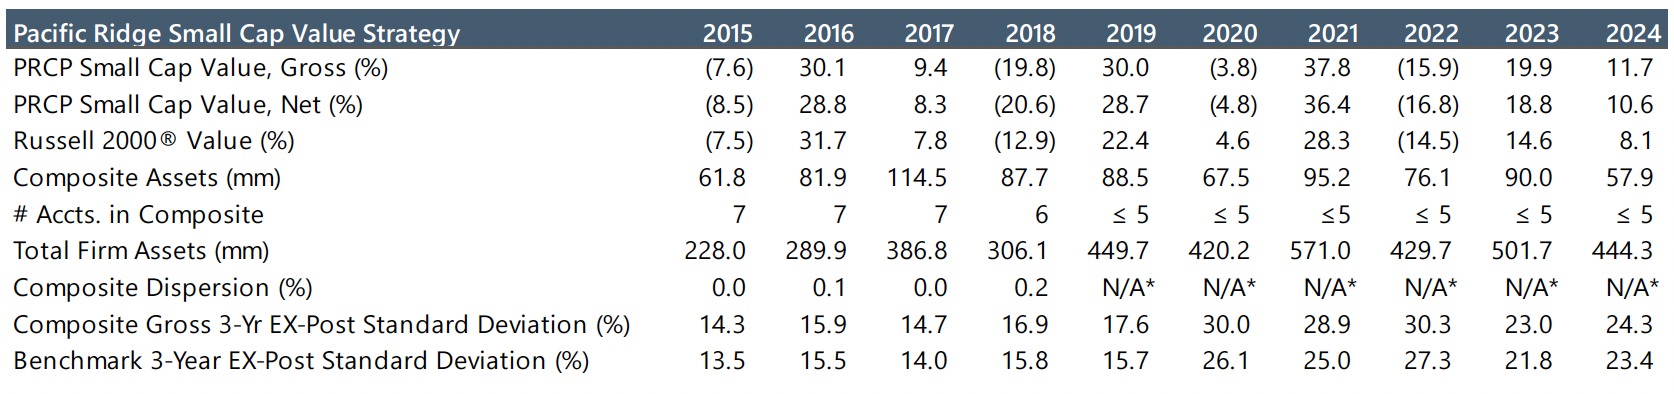
*Information is not statistically meaningful due to an insufficient number of portfolios in the composite for the entire year.
Disclosures
Pacific Ridge Capital Partners, LLC (“Pacific Ridge”, “PRCP”, or “the Firm”) is a 100% employee-owned investment advisor registered with the Securities and Exchange Commission under the Investment Advisors Act of 1940. The Firm was established in June 2010 and has one office located in Lake Oswego, Oregon. Pacific Ridge claims compliance with the Global Investment Performance Standards (GIPS®) and has prepared and presented this report in compliance with the GIPS standards. Pacific Ridge has been independently verified for the periods June 10, 2010, through June 30, 2025. A firm that claims compliance with the GIPS standards must establish policies and procedures for complying with all the applicable requirements of the GIPS standards. Verification provides assurance on whether the firm’s policies and procedures related to composite and pooled fund maintenance, as well as the calculation, presentation, and distribution of performance, have been designed in compliance with the GIPS standards and have been implemented on a firmwide basis. The Small Cap Value Composite has had a performance examination for the period from June 10, 2010, through June 30, 2025. The verification and performance examination reports are available upon request.
The Small Cap Value Composite (“Strategy”) was created and incepted on August 1, 2010. The Small Cap Value Composite comprises fully discretionary portfolios managed by the Firm invested primarily in an equity portfolio of small companies with market capitalizations similar to those found in the bottom three-quarters of the Russell 2000® Index. The Strategy adheres to a disciplined bottom-up fundamental selection process with emphasis given to the cash flow generating capabilities of a company. The Strategy’s objective is to outperform the Russell 2000® Value Index, which is used as its benchmark. Eligible portfolios must be managed for a full calendar month prior to inclusion in the Small Cap Value Composite. Composite dispersion is measured using an asset-weighted standard deviation of gross returns of the portfolios included for the entire year. Returns and asset values are stated in US dollars.
The Russell 2000® Value Index measures the performance of the Russell 2000 companies with lower price-to-book ratios and lower forecasted growth values. For comparison purposes, the index is fully invested, which includes the reinvestment of income. The return for the index does not include any transaction costs, management fees or other costs. It is not possible to invest directly in the Index.
Sources: Pacific Ridge; FactSet Research Systems (“FactSet”); and London Stock Exchange Group, the source of FTSE Russell (“Russell”), the source of the Russell Index data.
Returns for the Small Cap Value Composite are time-weighted and presented gross and net of management fees and other expenses, and include realized and unrealized gains and losses, cash and cash equivalents and related interest income, and accrued dividends. Net returns are calculated by deducting the highest annual management fee of 1.00% from the quarterly gross composite return. Performance-based fees are available upon request. All returns are calculated after the deduction of the actual trading expenses incurred during the period.
The fee schedule for separately managed accounts is a flat rate of 1.00%.
The portfolio characteristics, sector weightings, and attribution analysis for the Small Cap Value Composite are based on a representative account within the Strategy. The representative account statistics are shown as supplemental information. The Firm maintains a complete list of contributors and detractors to portfolio returns as well as a complete list and description of composites and pooled funds and policies for valuing portfolios, calculating performance, and preparing GIPS Reports, all of which are available upon request by contacting Peter Trumbo, Chief Operating Officer/Chief Compliance Officer, at (503) 886-8972 or Peter.Trumbo@PacificRidgeCapital.com.
GIPS is a registered trademark of CFA Institute. CFA Institute does not endorse or promote this organization, nor does it warrant the accuracy or quality of the content contained herein.
Top and Bottom Performing Securities represent those security holdings that had the largest positive and negative total contribution to the portfolio’s return for the quarter. Top and Bottom Economic Sectors represent those sectors that had the largest positive and negative total contribution to the portfolio’s return. The holdings identified do not represent all the securities purchased, sold, or recommended to clients.
In order to maintain consistency when comparing the Small Cap Value strategy to the Russell benchmark, the Firm utilizes FactSet’s outlier methodology calculations, which provide a portfolio characteristic calculation methodology comparable to that which Russell applies to its indices.
The information provided should not be considered a recommendation to purchase or sell any particular security. There is no assurance that any securities discussed herein will remain in our Strategy at the time you receive this report or that securities sold have not been repurchased. It should not be assumed that any of the holdings discussed herein were or will be profitable or that the investment recommendations or decisions we make in the future will be profitable or will equal the investment performance of the securities discussed herein. Past performance is no guarantee of future results.
Although the statements of fact and data in this report have been obtained from, and are based upon, sources that the Firm believes to be reliable, we do not guarantee their accuracy, and any such information may be incomplete or condensed. All opinions included in this report constitute the Firm’s judgment as of the date of this report and are subject to change without notice.
This report is for informational purposes only and is not intended as an offer or solicitation with respect to the purchase or sale of any security.