

Performance Review
The Pacific Ridge Capital Partners Micro Cap Value Strategy (the “Strategy”) returned 12.7%* (12.3%* net of fees) for the quarter ended September 30, 2025, underperforming the Russell Microcap® Value Index (the “Index”) return of 15.0%. For the trailing twelve-month period, the Strategy returned 20.5%* (18.7%* net of fees), outperforming the Index return of 16.3%.

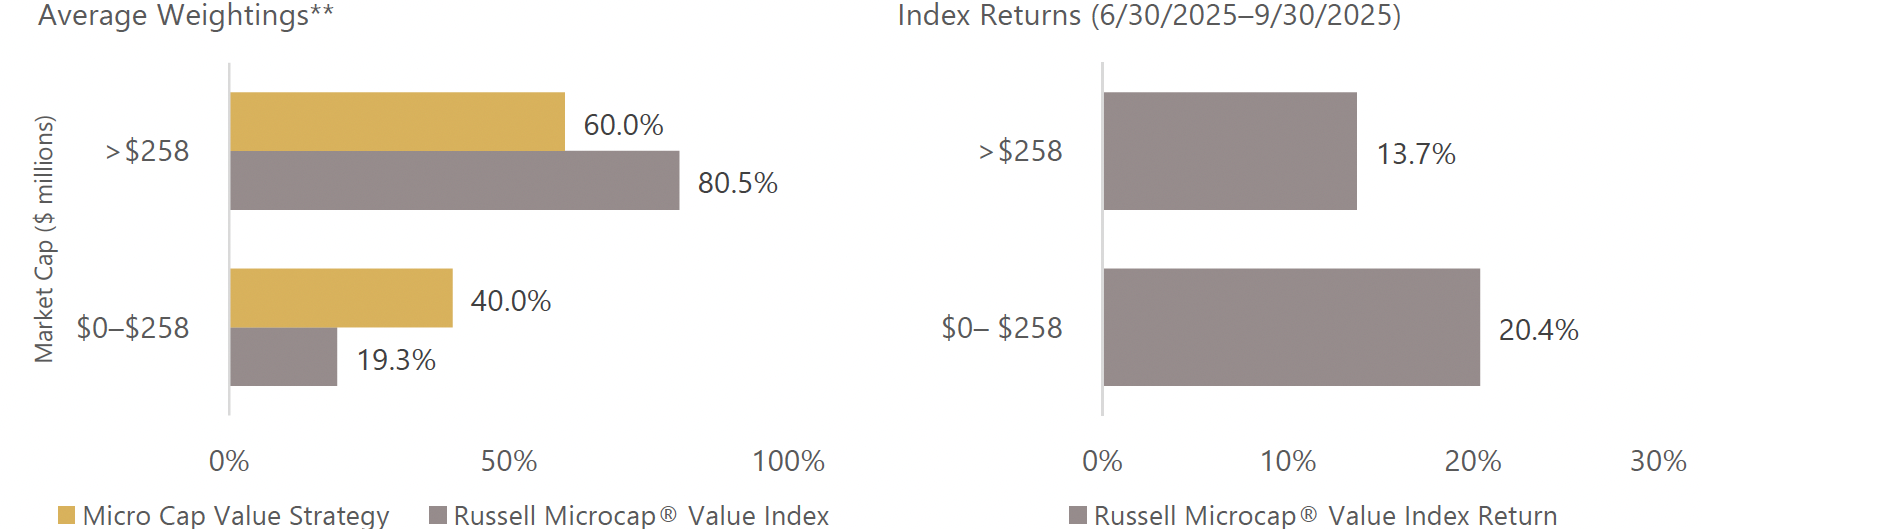
Size Analysis
The third quarter of 2025 saw smaller (below median market capitalization) stocks outperform the larger stocks held by the Index (20.4% versus 13.7% respectively). This provided a slight tailwind for our Strategy, given our emphasis on smaller names. Digging a little deeper, the quarter was essentially barbelled, with the very largest quintile of companies outperforming all other segments with a 25.0% return, to the detriment of the Strategy. The middle range by market cap only mustered single-digit returns, while the very smallest stocks had a very positive quarter, although not quite on par with the largest ones.
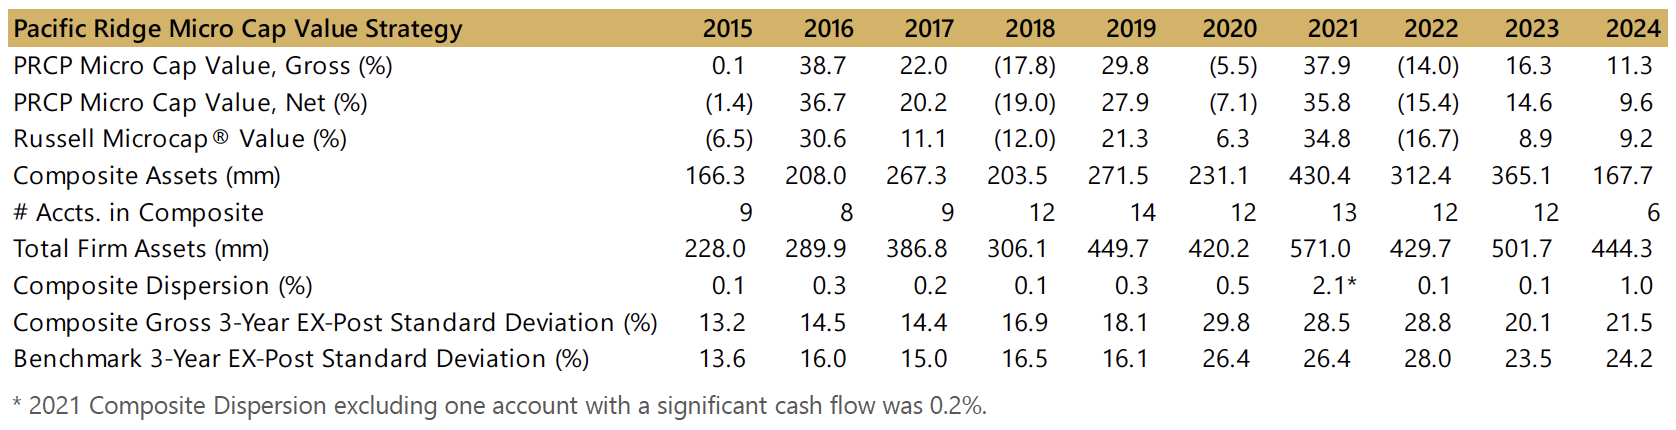
*Preliminary results. For additional performance information, see the related GIPS® Report on page 6.
**The size breakpoint in the chart is based on the Index’s median market capitalization at the beginning of the period.
The Strategy’s portfolio characteristics may differ significantly from those of the Index because we primarily invest in smaller, undervalued stocks and adopt a sector-agnostic approach. You can see these distinctions in the charts above and on the following pages.
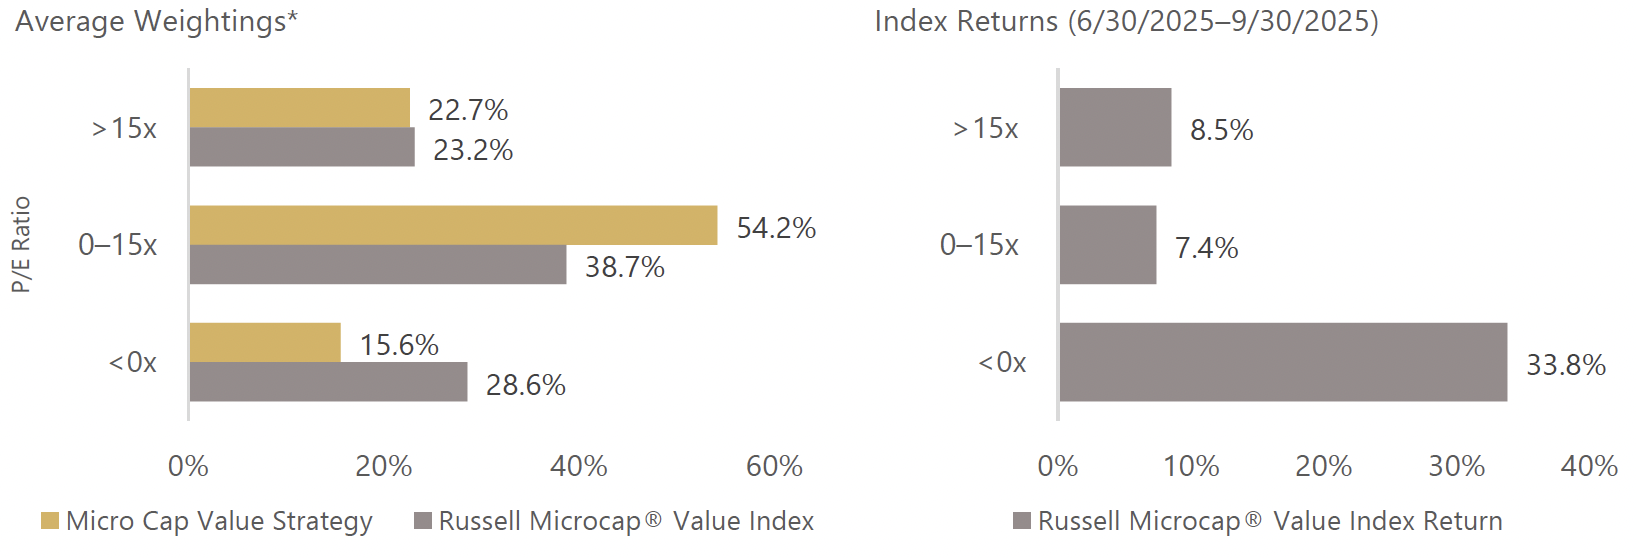
Style Analysis
The Strategy’s emphasis on profitable companies was a meaningful headwind in the third quarter, much like it was in the second quarter. Unprofitable companies (P/E <0x) posted significant gains again (33.8% vs. 15.0% for the Index), dwarfing the performance of stocks with positive earnings, which yielded high single-digit returns within the Index and low double-digit returns within the Strategy. The Strategy faced a further small headwind from higher-valuation profitable stocks (P/E >15x) slightly outperforming lower-valuation stocks (P/E <15x).
Sector Analysis
The two top contributing sectors to the Strategy’s performance for the quarter were the Consumer Discretionary and Information Technology sectors. Both were additive due to the Strategy’s holdings outperforming the Index’s holdings, offset by a small allocation effect headwind from the Strategy’s overweight to the Consumer Discretionary sector and underweight in Technology. Conversely, the two sectors that most negatively impacted the Strategy’s performance were Health Care and Financials. The Strategy maintains a strategic underweight to Health Care, which was the strongest-performing sector in the Index for the quarter with a return of 32.5%. The Strategy’s overweight to Financials also detracted from relative performance, as the Financials sector significantly underperformed the overall Index. Stock selection within those sectors had minor negative impact.

*P/E ratios are based on analyst estimates for the current fiscal year, including both completed and estimated quarterly results. Companies that have no earnings estimates have been excluded, and thus the bars may not add up to 100%.
The Strategy’s portfolio characteristics may differ significantly from those of the Index because we primarily invest in smaller, undervalued stocks and adopt a sector-agnostic approach.
Portfolio Characteristics

Top Contributors

Motorcar Parts of America (“MPAA”) is a manufacturer of automotive parts (primarily starters, alternators, and brake components). MPAA shares outperformed for the quarter after the company reported record results for fiscal 1Q26—net sales up 10.9% to $188.4M, gross profit up 16.3%, and a swing to $20.1M in operating income from a loss a year ago—alongside positive cash generation, lower net bank debt, and ongoing buybacks. While MPAA shares still trade at a meaningful discount to our implied value, we used the strength of the company’s third quarter performance to trim what had become a sizable position in the Strategy.
AXT (“AXTI”) is a material sciences company that is one of very few suppliers of semiconductor substrate alternatives to silicon wafers, including the compounds gallium arsenide (GaAs) and indium phosphide (InP). As most of its operations are based in China, AXTI has been subject to significant tariffs and export restrictions. Earlier in the year, this drove shares to trade well below their tangible book value. With recent loosening of export restrictions by the Chinese government and continued data center demand for optical transport that uses InP, AXTI shares have begun to recover in anticipation of much stronger results.
Cooper-Standard Holdings (“CPS”) manufactures sealing, fuel, brake delivery, and fluid transfer systems for passenger vehicles. Its primary customers are large OEMs such as Ford, GM, and Stellantis, with a smaller segment dedicated to supplying automotive Tier 1 suppliers. Shares performed well during the quarter, as the company benefited from higher production volumes and improved cost controls, particularly in North America. CPS has also made progress deleveraging its balance sheet and improving margins, which we believe the market has begun to reward. We have been reducing the Strategy’s weight in CPS as its share price gets closer to our target.
Kimball Electronics (“KE”) is a contract manufacturer of goods for partners, with a rough end-market split of 50% automotive, 25% medical, and 25% industrial. Despite revenue growth being diminished by some issues with two big customers that were out of KE’s control, management has done a nice job driving operating margin expansion via efficiencies and strong free cash flow from working capital improvements. As a result, the stock price improved during the quarter. As KE replenishes its manufacturing capacity and diversifies away from the cyclical automotive space, a more favorable valuation should be afforded to its shares.
Bowman Consulting Group (“BWMN”), a consulting firm offering engineering solutions, surpassed expectations last quarter driven by revenue growth across all end markets and strong operating leverage that produced record profitability. The company’s expanded capabilities in complex power infrastructure design have led to significant demand from data center projects transitioning from site development to long-term energy solutions. The elevated backlog and benefits from scale should lead to higher earnings in the near term.
Top Detractors
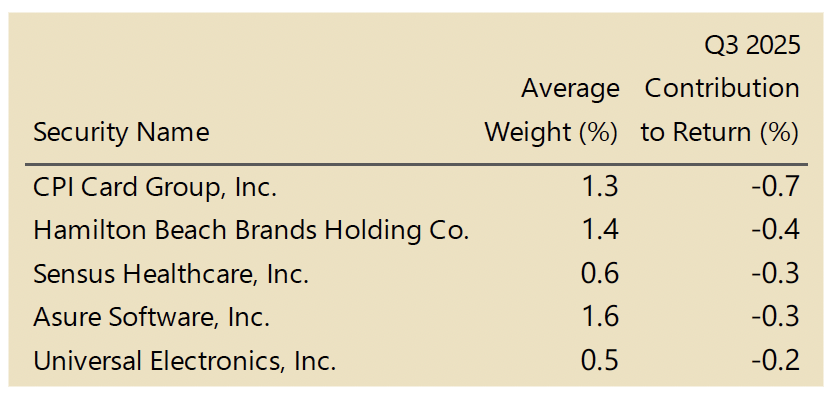
CPI Card Group (“PMTS”) manufactures payment cards and instant-issuance solutions in the US. Shares underperformed in the third quarter after 2Q25 results missed expectations, with profit margins declining due to mix, higher production costs (including tariffs), and additional expenses tied to the transition to a new secure card facility. Management raised full-year sales guidance but kept EBITDA growth unchanged, noting higher tariff expense headwinds and flagging uncertainty from proposed chip-tariff measures announced in early August. We have continued to add to our position in the company, as the share price is currently well below its implied value.
Hamilton Beach Brands (“HBB”) designs, markets, and distributes electric household and home products, primarily kitchen appliances. In light of the recent tariffs, the company is facing a decline in retailer demand for their products, causing management to pull guidance. Industry competitors are facing similar issues. The company has taken action to minimize impact on their margins, including cost-cutting measures, price adjustments, and diversification of manufacturing away from China. Their core business continues to be a market leader in North America.
Sensus Healthcare (“SRTS”) produces medical devices for the treatment of non-melanoma skin cancer via superficial radiation therapy, an alternative to surgical treatment. Shares were down in the third quarter due to proposed reimbursement rate changes that affect how steps in the cancer treatment process are reimbursed. Until the changes are finalized, it is difficult for Sensus to market their machines to dermatology clinics, and sales will be impacted. The proposed changes are expected to benefit company performance if finalized, though there will be a transition as they shift to a different flagship product. In the long term, Sensus remains a potential acquisition target for their largest customer.
Asure Software (“ASUR”) is a payroll services and human resources software provider that primarily focuses on small- to medium-sized businesses but has been increasingly targeting larger enterprises. The company reported third-quarter results slightly below expectations but increased full-year guidance. They also completed the acquisition of an attractive and growing time and attendance software company during the quarter, which should create cross-selling opportunities, but also came at a premium valuation. Management has a history of meeting expectations inconsistently, so the market appears to be taking a wait-and-see approach for the moment.
Universal Electronics (“UEIC”), a developer and manufacturer of wireless control products for home entertainment, smart home, and security markets, reported earnings above expectations last quarter but gave a soft outlook for the rest of the year. New products in the connected home space have become a more meaningful part of the company’s sales mix, but inconsistent order rates are expected to limit growth in the near term. Free cash flow, however, has been steady, boosting the company’s balance sheet to a net cash position for the first time in four years.
Market Review and Outlook
The third quarter of 2025 is best characterized as a period of euphoria tempered by concerns over future growth. The Federal Reserve resumed cutting interest rates in September in an attempt to support the weakening labor market amid continued uncertainty surrounding trade policy. Equity markets performed very well, with the S&P 500 and Nasdaq rallying by 8.1% and 11.4%, respectively. AI stocks continued to perform very well, as numerous partnerships and investments in that space were announced during the quarter.
Offsetting the strength in the US market were concerns about the looming government shutdown and delays in economic data releases due to turnover in personnel at the Bureau of Labor Statistics (BLS). Escalating trade tensions with China over technology exports also warrant close monitoring. A strong earnings season with 81% of S&P 500 companies exceeding expectations proved to be a key driver of stock performance.
While economic data points towards market resilience, labor indicators show clear signs of weakness. GDP for the first half of 2025 was under 2%, while the unemployment rate ticked higher and monthly nonfarm payroll growth is slowed significantly. Inflation readings are modest but still meaningfully above the Fed’s 2% target. President Trump has called for additional rate cuts to help fuel growth, though this risks driving inflation higher over the long term, putting Federal Reserve Chairman Powell in a very difficult position.
If there is further economic deterioration, we are more concerned about the depth and duration of the downturn rather than the technical declaration of a recession or its timing. Massive investments in AI infrastructure have amplified the risk of a bubble, harkening back to the dot-com era. Warning cracks in private credit are appearing as well: older vintage deals are seeing rising defaults, and widening spreads indicate strains in direct lending as well as higher borrowing costs.
We will continue to focus on finding attractive companies with superior risk-adjusted returns in the Small and Micro Cap Value universe, targeting firms with strong balance sheets and track records of free cash flow generation.
Other Professionals
Investment Team

PRCP GIPS Report

Disclosures
Pacific Ridge Capital Partners, LLC (“Pacific Ridge”, “PRCP”, or “the Firm”) is a 100% employee-owned investment advisor registered with the Securities and Exchange Commission under the Investment Advisors Act of 1940. The Firm was established in June 2010, and has one office located in Lake Oswego, Oregon. Pacific Ridge claims compliance with the Global Investment Performance Standards (GIPS®) and has prepared and presented this report in compliance with the GIPS standards. Pacific Ridge has been independently verified for the periods June 10, 2010, through June 30, 2025. A firm that claims compliance with the GIPS standards must establish policies and procedures for complying with all the applicable requirements of the GIPS standards. Verification provides assurance on whether the firm’s policies and procedures related to composite and pooled fund maintenance, as well as the calculation, presentation, and distribution of performance, have been designed in compliance with the GIPS standards and have been implemented on a firmwide basis. The Micro Cap Value Composite has had a performance examination for the period from June 10, 2010, through June 30, 2025. The verification and performance examination reports are available upon request.
The Micro Cap Value Composite (“Strategy”) was created on June 10, 2010, and incepted on April 1, 2007. Performance from 2007 to 2010 is from portfolios managed at another entity. The Micro Cap Value Composite comprises fully discretionary portfolios managed by the Firm invested primarily in a concentrated equity portfolio of smaller companies with market capitalizations similar to those found in the Russell Microcap® Index. Smaller market capitalization equities have historically had greater volatility than larger market capitalization equities. The Strategy adheres to a disciplined bottom-up fundamental selection process with an emphasis given to the cash flow generating capabilities of a company. The Strategy’s objective is to outperform the Russell Microcap® Value Index, which is used as its benchmark. Eligible portfolios must be managed for a full calendar month prior to inclusion in the Micro Cap Value Composite. Composite dispersion is measured using an asset-weighted standard deviation of gross returns of the portfolios included for the entire year. Returns and asset values are stated in US dollars.
The Russell Microcap® Value Index measures the performance of the micro cap segment of the U.S. equity market. For comparison purposes, the Index is fully invested, which includes the reinvestment of income. The return for the Index does not include any transaction costs, management fees or other costs. It is not possible to invest directly in the Index.
Sources: Pacific Ridge; FactSet Research Systems (“FactSet”); and London Stock Exchange Group, the owner of FTSE Russell (“Russell”), the source of the Russell Index data.
Returns for the Micro Cap Value Composite are time-weighted and presented gross and net of management fees and other expenses, and include realized and unrealized gains and losses, cash and cash equivalents and related interest income, and accrued dividends. Net returns are calculated by deducting the highest annual management fee of 1.50% from the quarterly gross composite return. Performance-based fees are available upon request. All returns are calculated after the deduction of the actual transaction costs incurred during the period.
The fee schedule for separately managed accounts is a flat rate of 1.50%.
The portfolio characteristics, sector weightings, and attribution analysis for the Micro Cap Value Composite are based on a representative account within the Strategy. The representative account statistics are shown as supplemental information. The Firm maintains a complete list of contributors and detractors to the portfolio’s return as well as a complete list and description of composites and pooled funds and policies for valuing portfolios, calculating performance, and preparing GIPS Reports, all of which are available upon request by contacting Peter Trumbo, Chief Operating Officer/Chief Compliance Officer, at (503) 886-8972 or Peter.Trumbo@PacificRidgeCapital.com.
GIPS is a registered trademark of CFA Institute. CFA Institute does not endorse or promote this organization, nor does it warrant the accuracy or quality of the content contained herein.
Top and Bottom Performing Securities represent those security holdings that had the largest positive and negative total contribution to the portfolio’s return for the quarter. Top and Bottom Economic Sectors represent those sectors that had the largest positive and negative total contribution to the portfolio’s return. The holdings identified do not represent all the securities purchased, sold, or recommended to clients.
In order to maintain consistency when comparing the Micro Cap Value strategy to the Russell benchmark, the Firm utilizes FactSet’s outlier methodology calculations that provide a portfolio characteristic calculation methodology comparable to that which Russell applies to its indices.
The information provided should not be considered a recommendation to purchase or sell any particular security. There is no assurance that any securities discussed herein will remain in the Strategy at the time you receive this report or that securities sold have not been repurchased. It should not be assumed that any of the holdings discussed herein were or will be profitable or that the investment recommendations or decisions we make in the future will be profitable or will equal the investment performance of the securities discussed herein. Past performance is no guarantee of future results.
Although the statements of fact and data in this report have been obtained from, and are based upon, sources that the Firm believes to be reliable, we do not guarantee their accuracy, and any such information may be incomplete or condensed. All opinions included in this report constitute the Firm’s judgment as of the date of this report and are subject to change without notice.
This report is for informational purposes only and is not intended as an offer or solicitation with respect to the purchase or sale of any security.