

Performance Review
The Pacific Ridge Capital Partners Small Cap Value strategy (the “Strategy”) returned 4.6%* (4.3%* net of fees) during the second quarter ended June 30, 2025, underperforming the Russell 2000® Value Index (the “Index”) return of 5.0%. For the trailing twelve-month period, the Strategy returned 5.6%* (4.5%* net of fees), outperforming the Index return of 5.5%.
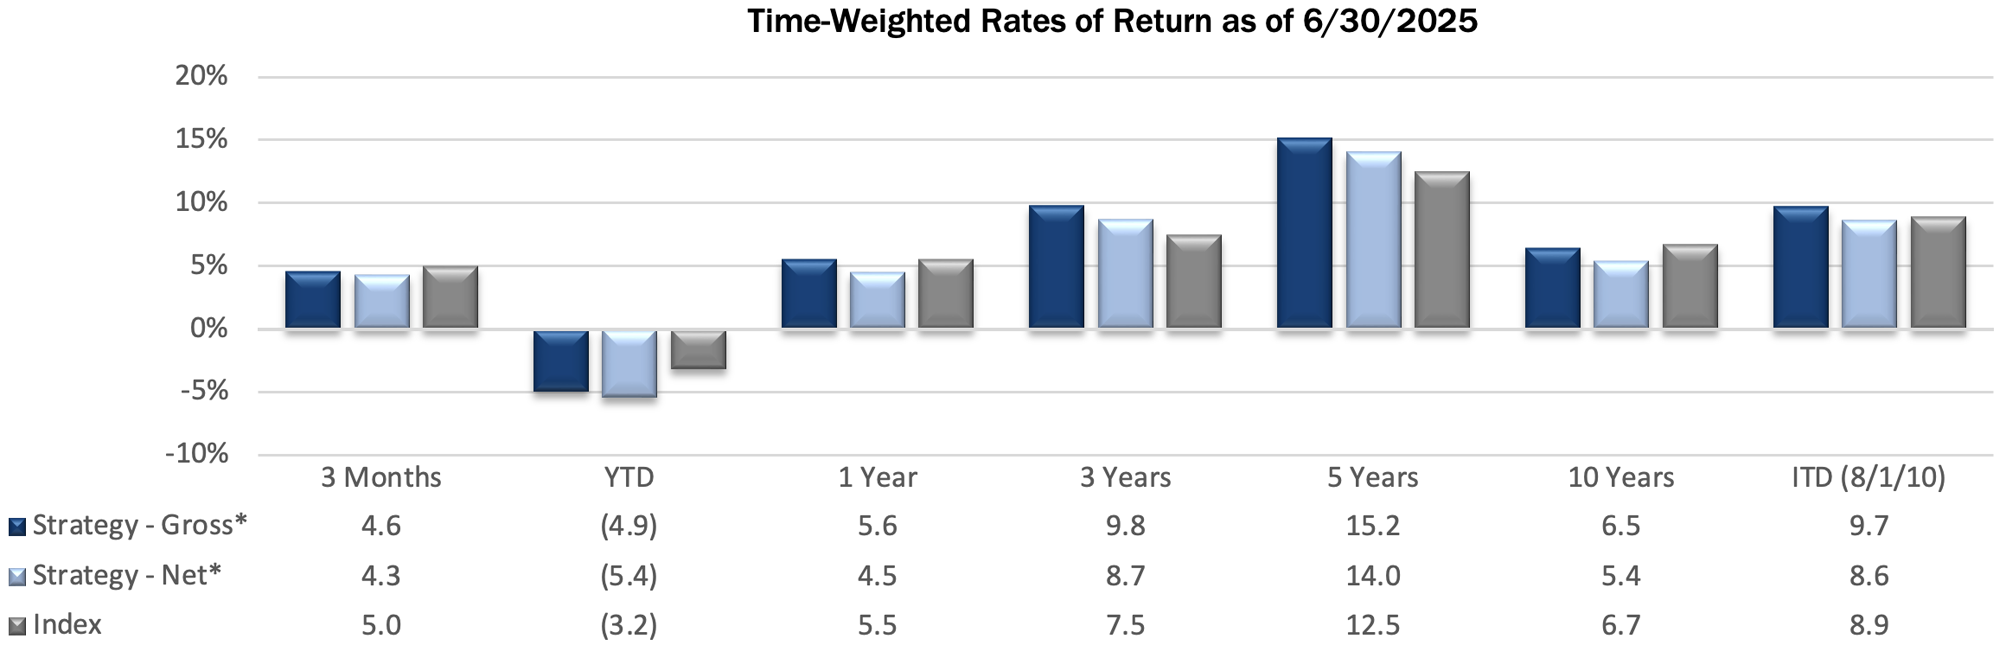
*For additional performance information, see the related GIPS® Report below.
The Strategy’s portfolio characteristics can be significantly different from the Index because we primarily invest in smaller, undervalued stocks and adopt a sector-agnostic approach. You can see these distinctions in the charts below.
Size Analysis
During the quarter, the Strategy benefited from a moderate tailwind related to its size bias, as smaller companies outperformed their larger counterparts within the Index. Companies with market capitalizations below the Index median of $638 million returned 10.7%, compared to a 4.2% return for those above the median. The Index held just 11.9% of its weight in companies below the median, while the Strategy maintained a significantly larger allocation at 38.9%.
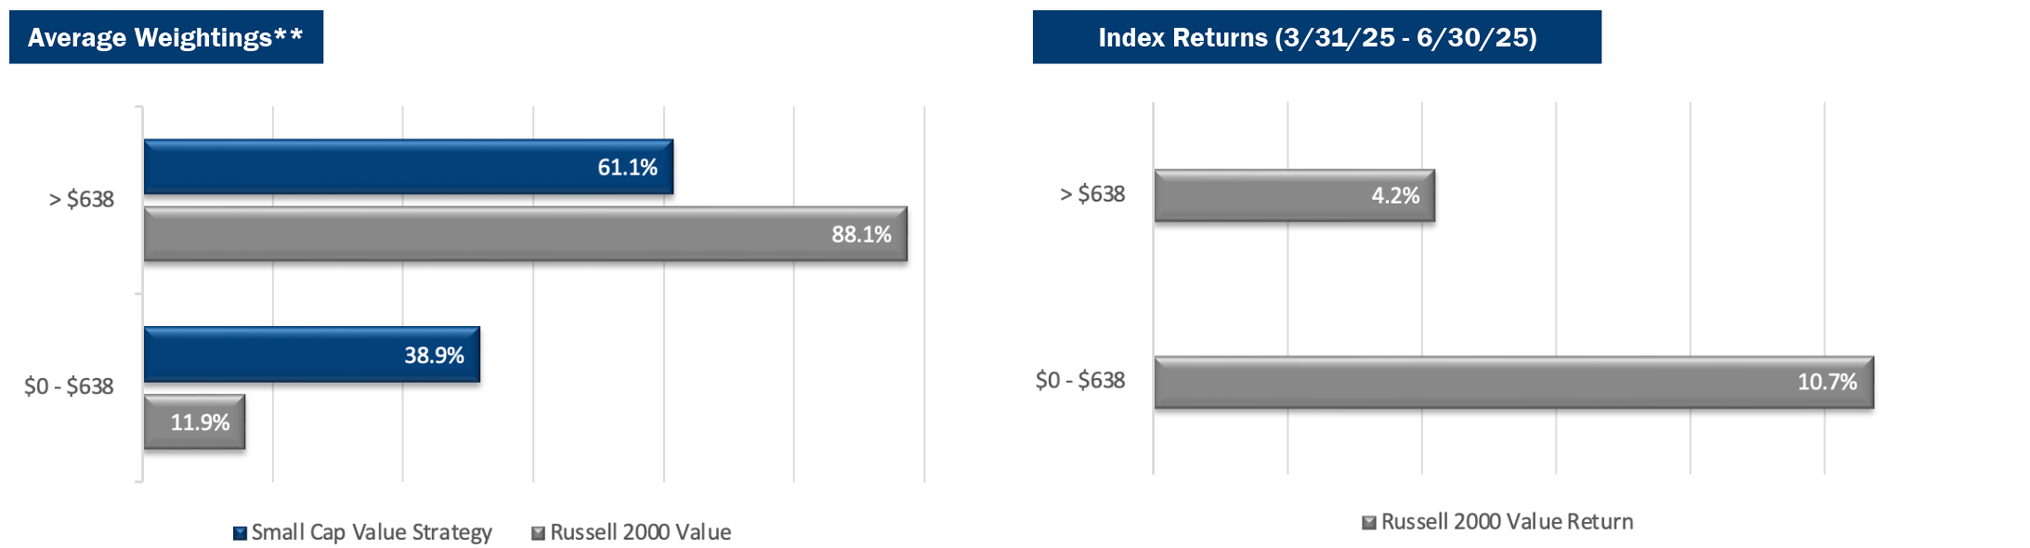
**The size breakpoint in the chart is based on the Index’s median market capitalization at the beginning of the period.
Style Analysis
The Strategy faced a modest headwind from style bias during the quarter, primarily due to its lower exposure to unprofitable companies (PE ratios below 0x), which were the best-performing segment in the Index with a return of 13.6%. The Index had a 13.3% weighting in these names, compared to just 7.1% for the Strategy. This drag was partially offset by stronger returns among profitable, lower-valuation companies (PE ratios below 15x), which outperformed higher-valuation peers (4.6% vs. 1.9%). The Strategy maintains a higher relative weighting in lower-valuation stocks compared to the Index.
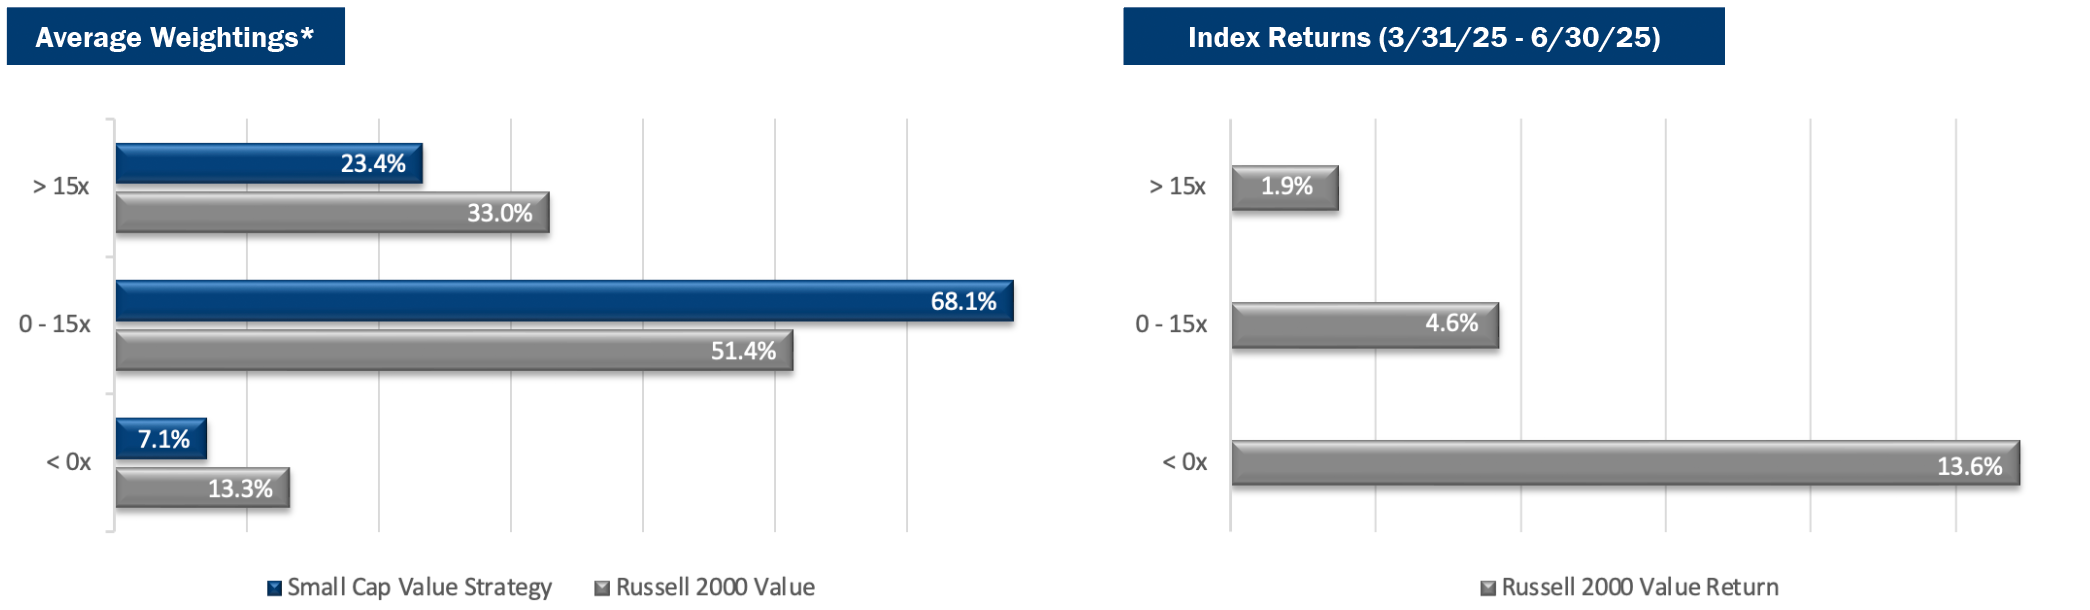
*P/E ratios are based on analyst estimates for the current fiscal year, including both completed and estimated quarterly results. Companies that have no earnings estimates have been excluded, and thus the bars may not add up to 100%.
Sector Analysis
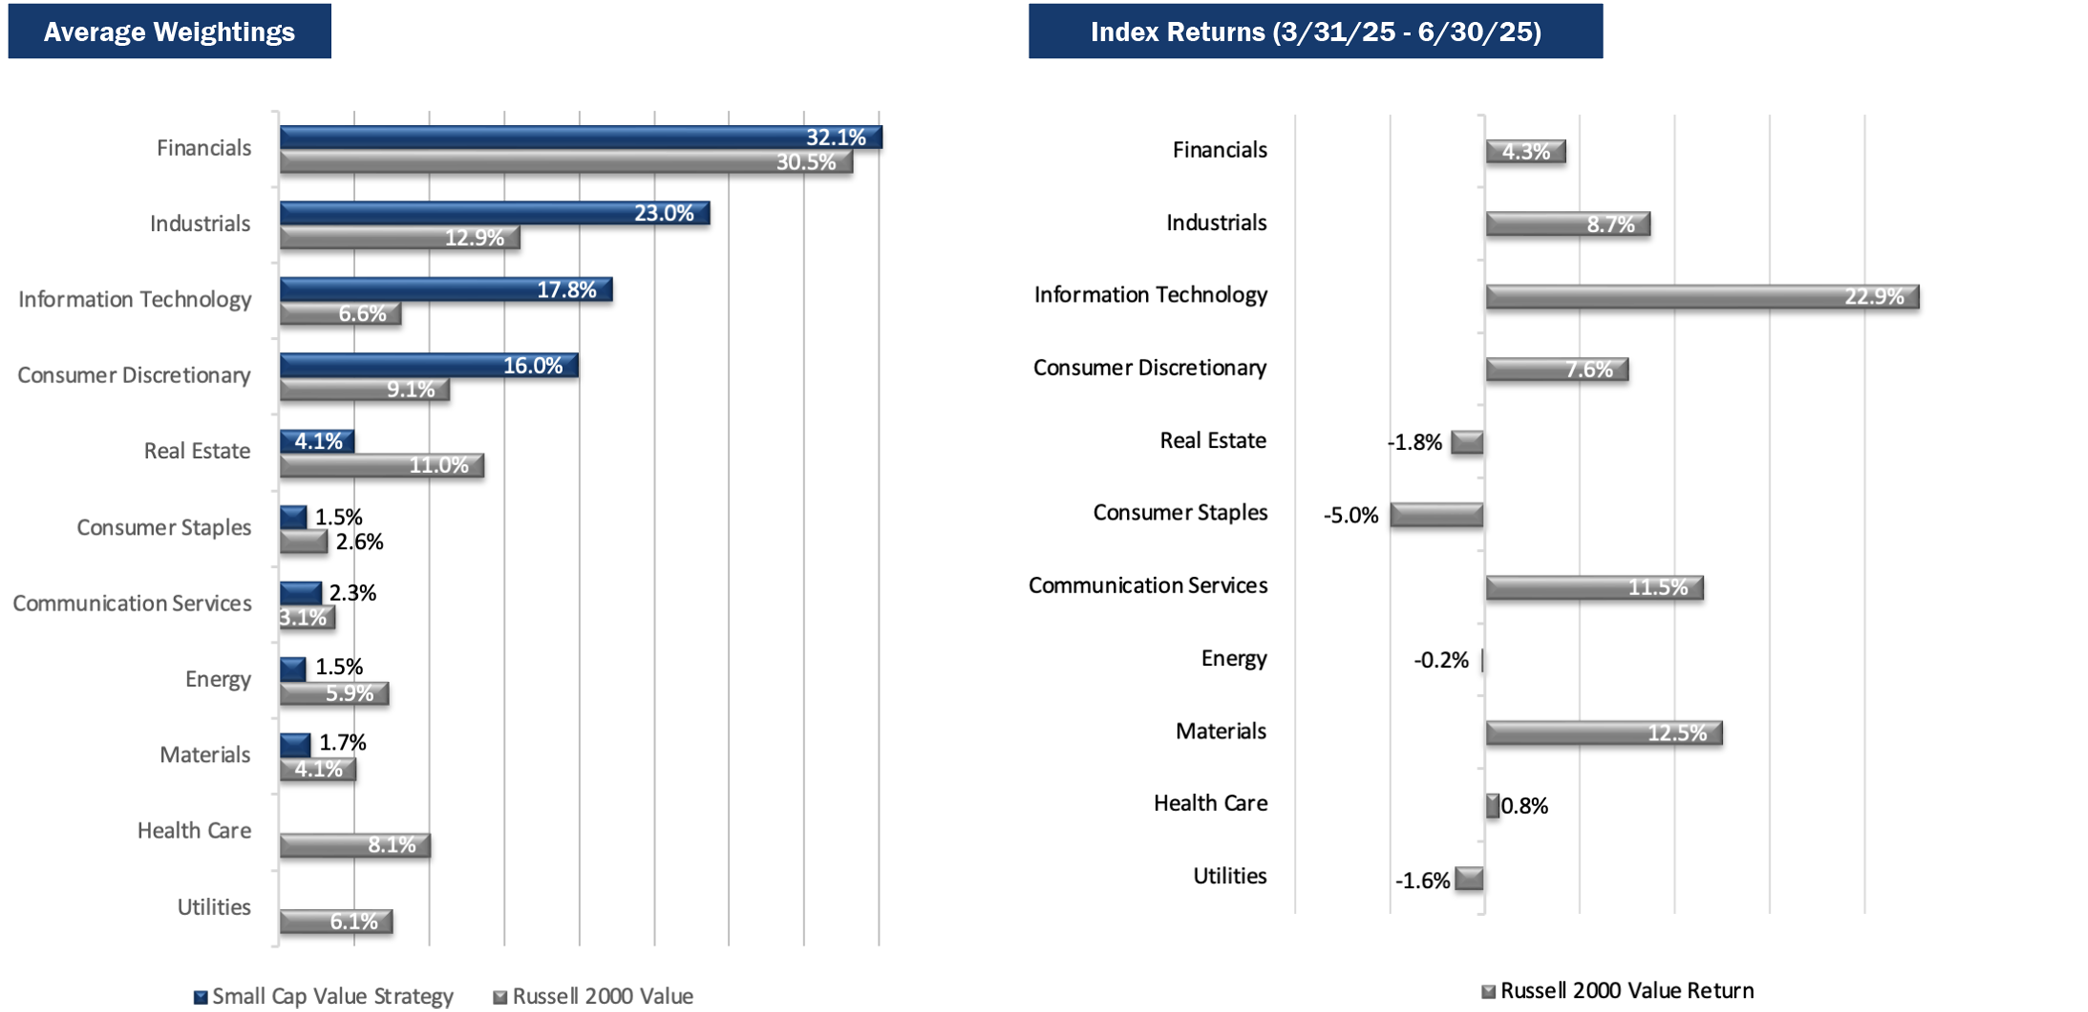
The top two contributing sectors to the Strategy’s performance were Energy and Utilities. An underweight in the poorly performing Energy sector, combined with favorable stock selection, added value. The Strategy’s lack of exposure to Utilities also provided a modest tailwind, as the sector declined 1.6% in the Index. In contrast, Communication Services and Information Technology were the largest detractors. The impact from Communication Services was almost entirely due to weakness in Stagwell, as discussed later. The Strategy’s overweight position in Information Technology was offset by poor stock selection, particularly as unprofitable tech names, most notably in semiconductors, led gains in the Index.
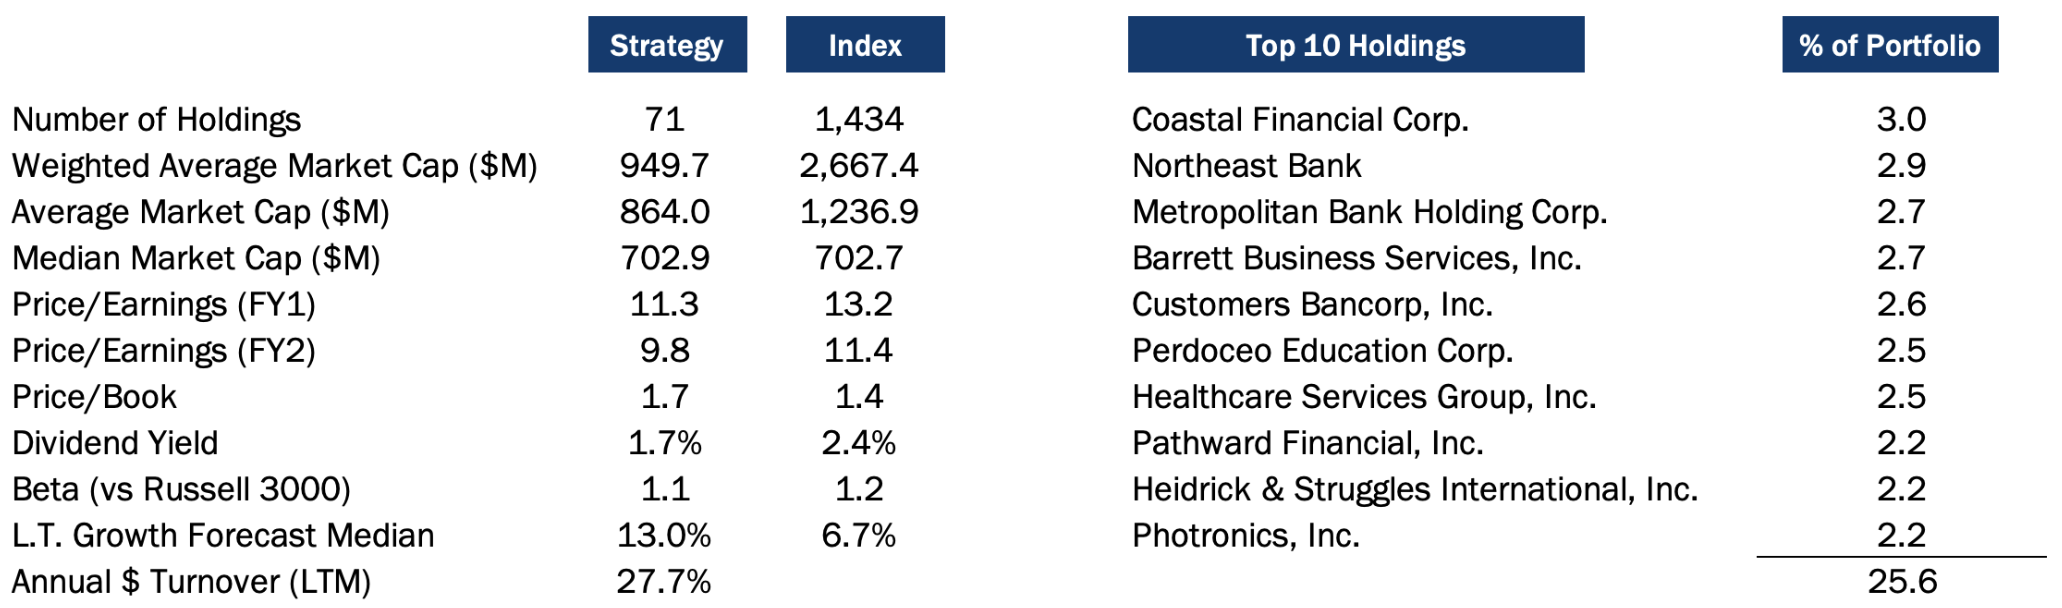
Portfolio Characteristics (as of 6/30/25)
Top Contributors
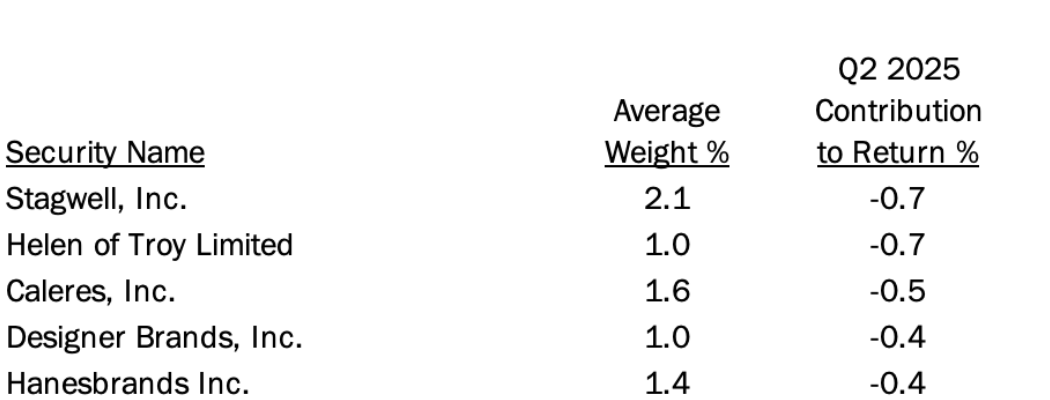
Top Detractors
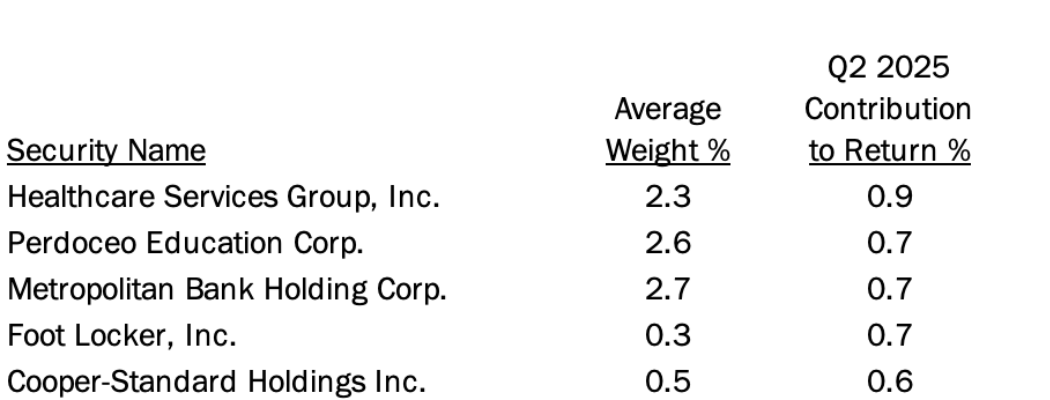
Top Contributors
Healthcare Services Group (“HCSG”) provides housekeeping and dietary services to senior housing facilities. The company reported results that exceeded expectations, with continued sales growth and hitting margin targets. Across the senior housing industry, occupancy rates have steadily recovered close to pre-pandemic levels, approaching prior peaks. Industry outlook is positive, with expected future demand from baby boomers. HCSG shares are returning to a more reasonable valuation, but it is common for high quality health care names to garner premium multiples.
Perdoceo Education (“PRDO”) is an education company operating several post-secondary schools. The stock has performed well due to the return of the former CEO and a softening labor market, two factors leading to enrollment growth and expanding margins. The expectation of more relaxed regulatory oversight from the current administration has also served as a tailwind. Operating in a counter-cyclical industry, the company would likely do well should the economy tip into a recession.
Metropolitan Community Bancorp (“MCB”) is a community bank based in Manhattan, NY. The stock performed well during the quarter as the bank continues to see very strong loan growth while broadening out their deposit base. Earnings estimates have been steadily moving higher as MCB appears to have fully exited businesses that were the source of regulatory scrutiny in years past. Despite the nice move higher, and us making some trims to this large position, the stock remains attractively valued.
Foot Locker, Inc. (“FL”), a global omni-channel retailer of shoes and apparel, was one of our shortest-lived holdings in the history of the Strategy. The company had been contending with shifting consumer trends and margin pressures. In May, FL announced a merger with Dick’s Sporting Goods, which sent shares soaring near their offer price. We did not anticipate another bidder to emerge, and the deal price aligned closely with our implied valuation. Given the market reaction and limited upside, we exited our position.
Cooper-Standard Holdings, Inc. (“CPS”) manufactures sealing, fuel, brake delivery, and fluid transfer systems for passenger vehicles. Shares performed well during the quarter as the company benefited from higher production volumes and improved cost controls, particularly in North America. CPS has also made progress deleveraging its balance sheet and improving margins, which we believe the market has begun to reward. We took the correction as an opportunity to exit our position.
Top Detractors
Stagwell (“STGW”) is a global advertising and marketing company. The stock declined during the quarter as the market reassessed expectations for ad spending amid an uncertain consumer environment. However, management expressed optimism about the year’s start and reaffirmed full-year 2025 guidance. Stagwell has increasingly positioned its business toward the digital advertising space, which has experienced spending pullbacks in recent years but shows signs of modest recovery. We continue to view the shares as attractively valued and maintain a sizable position in the portfolio.
Helen of Troy (“HELE”) is a global consumer products company with a portfolio of brands in the home, outdoor, beauty, and wellness space. Though the company has plans to shift production away from China over the next year, shares underperformed in the quarter with the increased uncertainty around how tariffs will impact its business. We anticipate that near-term volatility will continue but expect the company to generate superior long-term return on capital, as has been its custom.
Caleres, Inc. (“CAL”) is a footwear company best known for its Famous Footwear retail chain and a portfolio of owned brands. The company struggled with weak consumer demand and elevated inventory levels, which pressured margins and led to disappointing earnings. Management’s efforts to manage costs and focus on higher-margin brands have been met with headwinds from a more challenging retail environment than expected. Despite this, the wide gap between CAL’s current share price and our intrinsic valuation gives us continued confidence in stock’s long-term opportunity.
Designer Brands (“DBI”) owns a portfolio of shoe brands and operates a shoe retailer under the name DSW. Shares underperformed this quarter as the company reported results that fell short of expectations and lowered its guidance for the year. DBI is operating at historically low margins and store productivity, but we expect recent cost-cutting activities and brand acquisitions will help with the turnaround. The cyclical low in operating results has caused a trough in valuation, and once the company shows signs of stabilizing, shares should see significant upside.
HanesBrands (“HBI”) is a multi-brand manufacturer and designer of basic apparel such as t-shirts, underwear, bras, and socks. Tariff concerns caused the stock to sell off during the quarter. The majority of HBI’s customer base is located in the US, and no US products are sourced from China, mitigating supply costs. However, future tariffs are a concern across the retail apparel industry. HBI continues to work through a business turnaround after selling their Champion brand and paying down debt, which should allow the company to improve its free cash flow.
Market Review and Outlook
The second quarter of 2025 is best characterized as a period of volatility and uncertainty. It began with a major shock to capital markets as the tariffs proposed by the Trump administration on “Liberation Day” (April 2) far exceeded what had been previously expected. Equity markets quickly sold off, with the S&P 500 Index down 11.2% by April 8, which led to the Administration announcing a 90-day pause on some tariffs. The constant shift in policy and confusion around the eventual tariff levels and implementation timelines led to great uncertainty in the market.
This was compounded by geopolitical uncertainty surrounding the intensifying situation between Israel and Iran. Ultimately, the confidence that overly punitive tariffs would be delayed indefinitely, coupled with a de-escalation in the Middle East, helped spark a strong rally throughout the balance of the quarter, and the S&P 500 Index finished up 10.9% for the period. Global equity markets similarly posted robust returns.
After narrowly avoiding a recession last Fall through an improbable soft landing, economic data has been steady, if not robust. More recent quarterly GDP figures have not necessarily been reliable indicators given some pull forward activity as businesses sought to import goods in the first quarter ahead of tariff implementation. The labor market has been gradually cooling, evidenced by five straight months of contracting ISM Employment Index data through June. Numerous other measures of economic activity have been softening over the past several quarters. Additionally, President Trump has placed enormous pressure on Fed Chairman Powell to cut overnight rates, though uncertain trade policy and the potential inflationary impacts of tariffs have put the Fed Chair in a difficult position. Whether we tip into a recession or continue to proceed at below-trend growth is unclear.
If there is further economic deterioration, we are more concerned about the depth and duration of the downturn rather than the technical declaration of a recession or its timing. Currently, large cap and growth equity indices trade at stretched valuations and are vulnerable to a meaningful sell-off in the event of downward earnings revisions. That is where we see risk to the capital markets.
We will continue to focus on finding attractive companies with superior risk-adjusted returns in the Small and Micro Cap Value universe, targeting firms with strong balance sheets and a track record of free cash flow generation.
PRCP GIPS Report

*Information is not statistically meaningful due to an insufficient number of portfolios in the composite for the entire year.
Disclosures
Pacific Ridge Capital Partners, LLC (“Pacific Ridge”, “PRCP”, or “the Firm”) is a 100% employee-owned investment advisor registered with the Securities and Exchange Commission under the Investment Advisors Act of 1940. The Firm was established in June 2010, and has one office located in Lake Oswego, Oregon. Pacific Ridge claims compliance with the Global Investment Performance Standards (GIPS®) and has prepared and presented this report in compliance with the GIPS standards. Pacific Ridge has been independently verified for the periods June 10, 2010 through March 31 2025. A firm that claims compliance with the GIPS standards must establish policies and procedures for complying with all the applicable requirements of the GIPS standards. Verification provides assurance on whether the firm’s policies and procedures related to composite and pooled fund maintenance, as well as the calculation, presentation, and distribution of performance, have been designed in compliance with the GIPS standards and have been implemented on a firm-wide basis. The Small Cap Value composite has had a performance examination for the periods June 10, 2010 through March 31, 2025. The verification and performance examination reports are available upon request.
The Small Cap Value composite was created and incepted on August 1, 2010. The Small Cap Value composite comprises fully discretionary portfolios managed by the Firm invested primarily in an equity portfolio of small companies with market capitalizations similar to those found in the bottom three-quarters of the Russell 2000® Index. Smaller capitalization equities have historically had greater volatility than large capitalization equities. The Strategy ascribes to a disciplined bottom-up fundamental selection process with an emphasis given to the cash flow generating capabilities of a company. The Strategy’s objective is to outperform the Russell 2000 Value Index which is used as our benchmark. Eligible portfolios must be managed for a full calendar month prior to inclusion in the Small Cap Value composite. Composite dispersion is measured using an asset weighted standard deviation of gross returns of the portfolios included for the entire year. Returns and asset values are stated in US dollars.
The Russell 2000 Value Index measures the performance of the Russell 2000 companies with lower price-to-book ratios and lower forecasted growth values. For comparison purposes, the Index is fully invested, which includes the reinvestment of income. The return for the Index does not include any transaction costs, management fees or other costs. It is not possible to invest directly in the Index.
Sources: Pacific Ridge; FactSet Research Systems (“FactSet”); and Russell Investment Group (“Russell”) who is the source and owner of the Russell Index data.
Returns for the Small Cap Value composite are time-weighted and presented gross and net of management fees and other expenses and includes realized and unrealized gains and losses, cash and cash equivalents and related interest income, and accrued based dividends. Net returns are calculated by deducting the highest annual management fee of 1.00% from the quarterly gross composite return. Performance-based fees are available upon request. All returns are calculated after the deduction of the actual trading expenses incurred during the period.
The fee schedule for separately managed accounts is a flat rate of 1.00%.
The portfolio characteristics, sector weightings and attribution analysis for the Small Cap Value composite are based on a representative account within the Strategy. The representative account statistics are shown as supplemental information. The Firm maintains a complete list of contributors and detractors to portfolio return as well as a complete list and description of composites and pooled funds, policies for valuing portfolios, calculating performance, and preparing GIPS Reports, all of which are available upon request by contacting Peter Trumbo, Chief Operating Officer/Chief Compliance Officer at (503) 886-8972 or Peter.Trumbo@PacificRidgeCapital.com.
GIPS is a registered trademark of CFA Institute. CFA Institute does not endorse or promote this organization, nor does it warrant the accuracy or quality of the content contained herein.
Top and Bottom Performing Securities represent those security holdings that had the largest positive and negative total contribution to the portfolio return for the quarter. Top and Bottom Economic Sectors represent those sectors that had the largest positive and negative total contribution to the portfolio return. The holdings identified do not represent all the securities purchased, sold or recommended to clients.
In order to maintain consistency when comparing the Small Cap Value strategy to the Russell benchmark, the Firm utilizes FactSet’s outlier methodology calculations which provide a comparable portfolio characteristic calculation methodology as Russell applies to its indices.
The information provided should not be considered a recommendation to purchase or sell any particular security. There is no assurance that any securities discussed herein will remain in the Strategy at the time you receive this report or that securities sold have not been repurchased. It should not be assumed that any of the holdings discussed herein were or will be profitable or that the investment recommendations or decisions we make in the future will be profitable or will equal the investment performance of the securities discussed herein. Past performance is no guarantee of future results.
Although the statements of fact and data in this report have been obtained from, and are based upon, sources that the Firm believes to be reliable, we do not guarantee their accuracy, and any such information may be incomplete or condensed. All opinions included in this report constitute the Firm’s judgment as of the date of this report and are subject to change without notice. This report is for informational purposes only and is not intended as an offer or solicitation with respect to the purchase or sale of any security.
| Investment Team | Other Professionals | |||
| Dominic Marshall, CFA® | Senior Portfolio Manager | Peter Trumbo | Chief Operating Officer/Chief Compliance Officer | |
| Mark Cooper, CFA | Portfolio Manager | Mike McDougall | Senior Trader | |
| Ryan Curdy, CFA | Portfolio Manager | Sharif Farag | Director of Investor Relations | |
| Justin McKillip, CFA | Senior Analyst | Veronica Orazio | Operations Assistant | |
| Adam Wilkie, CFA | Senior Analyst | |||
| Laura Moon, CFA | Analyst | |||
CFA® is a trademark owned by the CFA Institute. |
||||