

Performance Review
The Pacific Ridge Capital Partners Micro Cap Value strategy (the “Strategy”) returned 13.6%* (13.1%* net of fees) during the second quarter ended June 30, 2025, outperforming the Russell Microcap® Value Index (the “Index”) return of 12.3%. For the trailing twelve-month period, the Strategy returned 22.2%* (20.3%* net of fees), significantly outperforming the Index return of 9.3%.
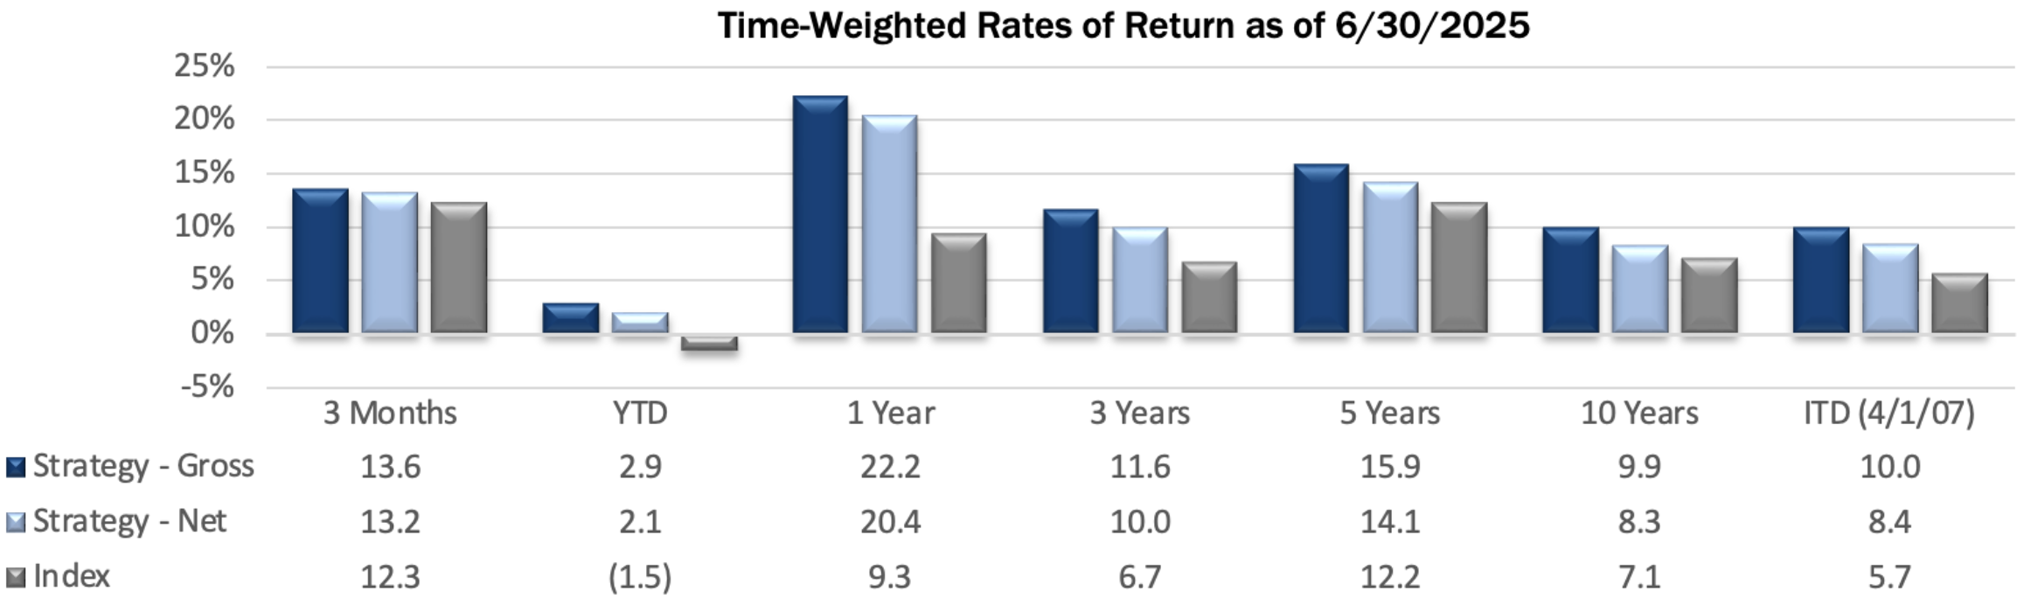
*For additional performance information, see the related GIPS® Report below.
The Strategy’s portfolio characteristics can be significantly different from the Index because we primarily invest in smaller, undervalued stocks and adopt a sector-agnostic approach. You can see these distinctions in the charts below.
Size Analysis
The Index exhibited a bifurcated outcome across market cap segments. The Strategy benefited from its size exposure, with one of the strongest tailwinds coming from its significant overweight in the smallest quintile of the Index. Companies with market capitalizations below $276 million returned 13.1%, and the Strategy held nearly 49% of its average weight in this group. While this was the second-best performing bin, the top quintile posted the highest returns, yet the Strategy remained underweight. Overall, size exposure contributed positively to relative performance.
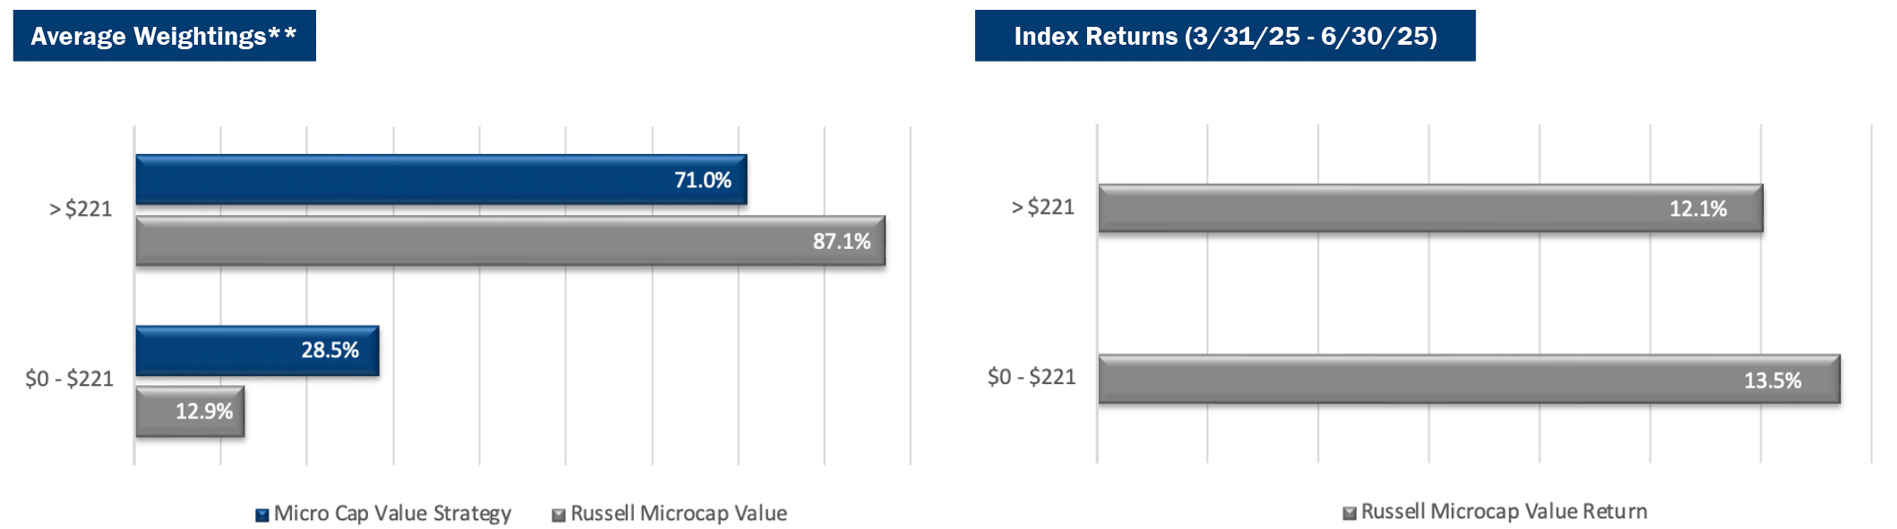
**The size breakpoint in the chart is based on the Index’s median market capitalization at the beginning of the period.
Style Analysis
The Strategy’s emphasis on profitable companies was a headwind in the quarter. Stocks with positive but modest valuations (PE ratios between 0x and 15x) outperformed those with higher valuations, and the Strategy was overweight this group at 60.7% versus 45.2% for the Index. Conversely, unprofitable companies (PE < 0x) posted massive gains (25.2% vs 12.3% for the Index). This trend was seen throughout the sector and size breakdowns.
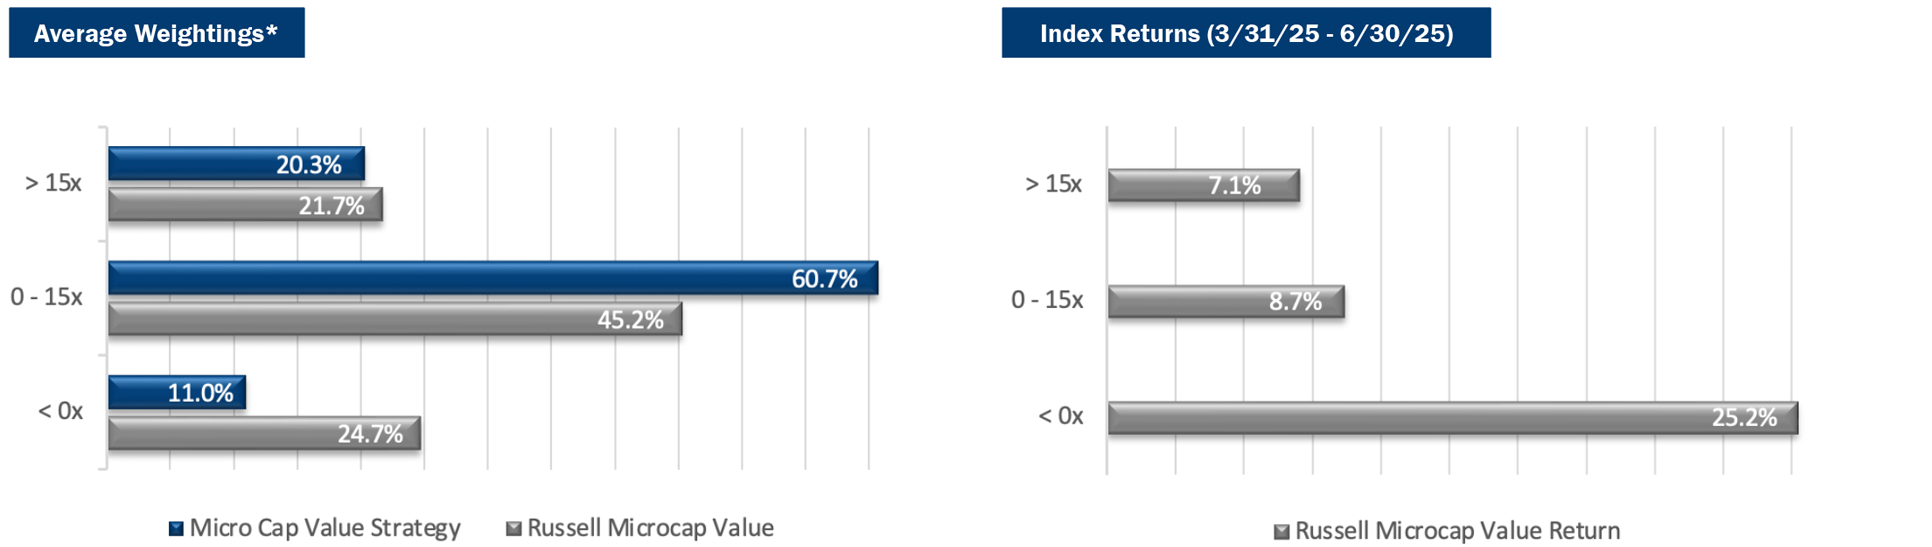
*P/E ratios are based on analyst estimates for the current fiscal year, including both completed and estimated quarterly results. Companies that have no earnings estimates have been excluded, and thus the bars may not add up to 100%.
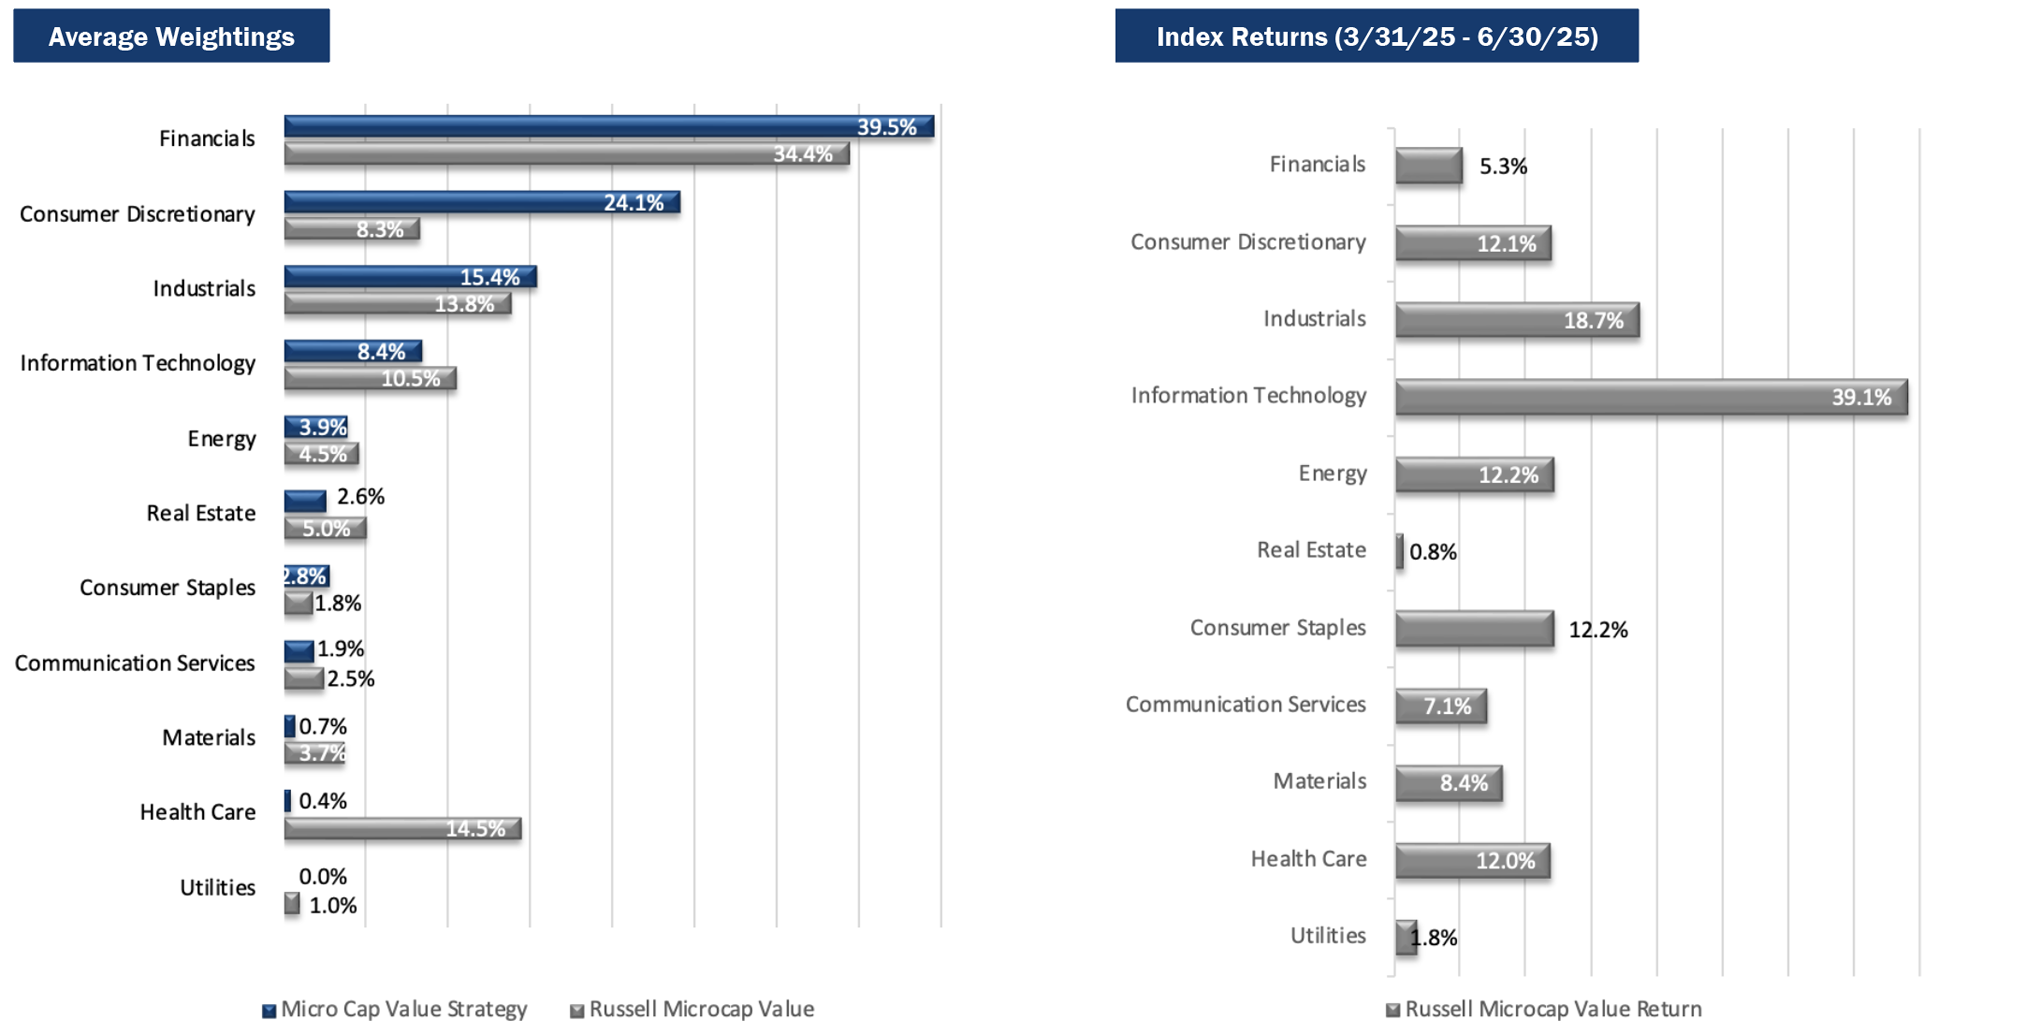
Sector Analysis
Financials and Communication Services were the strongest contributors to relative performance. Financials delivered strong absolute returns driven by stock selection. Communication Services, despite a modest underweight, contributed meaningfully, driven primarily by strength in DHI Group. Conversely, Information Technology and Industrials detracted from results. Technology lagged as the benchmark benefited from a 79% return in unprofitable companies. Industrials also weighed modestly on performance, primarily due to stock selection, as the Index returned 18.4% in the sector versus 12.5% for the Strategy.
Portfolio Characteristics (as of 6/30/25)
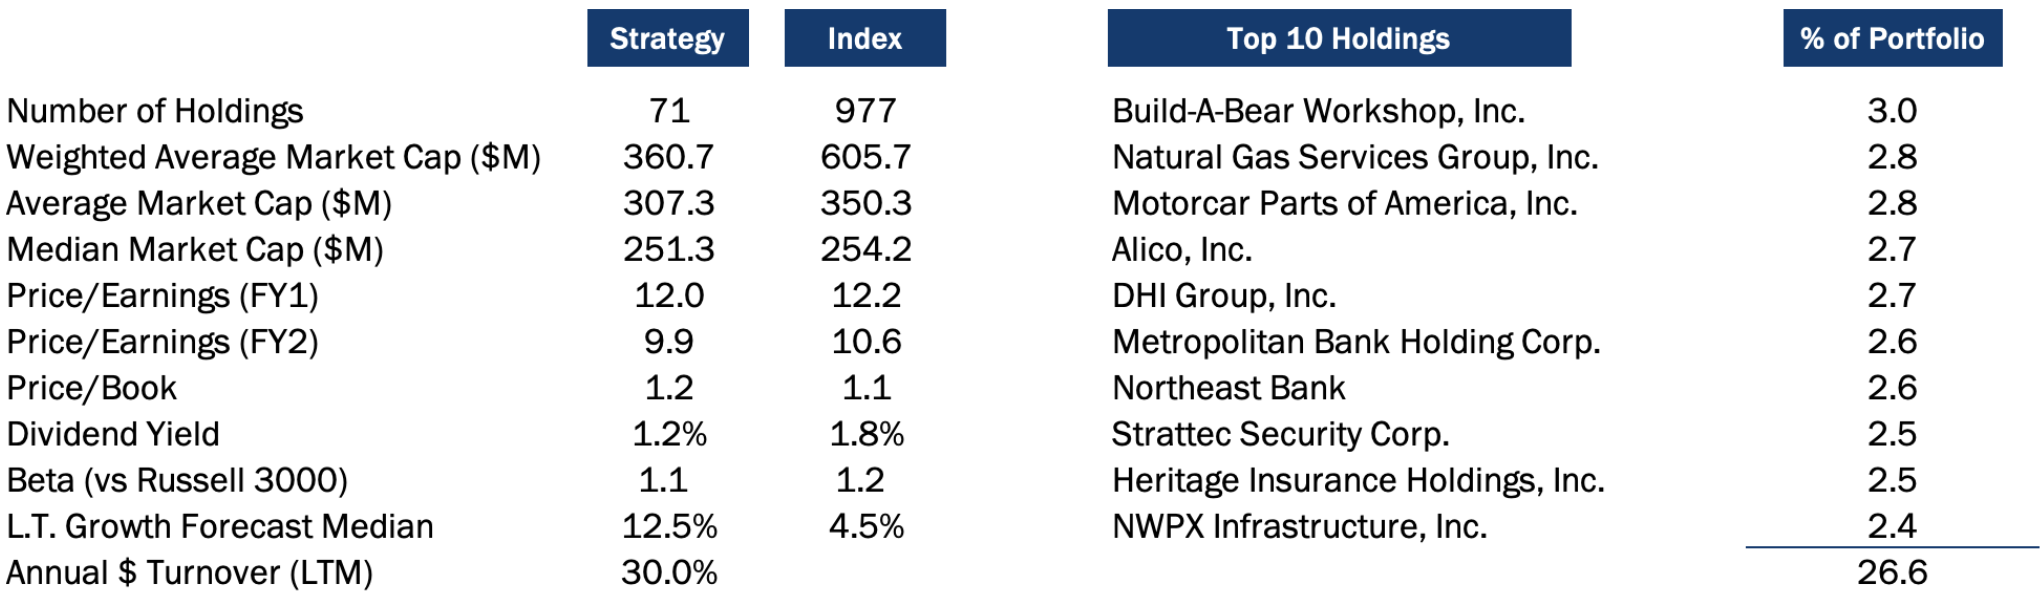
Top Contributors
Top Detractors

Top Contributors
Heritage Insurance Holdings (“HRTG”) is a property and casualty insurer based out of Florida. The stock performed very well over the first half of the year as the industry continues to benefit from Florida’s legislative reform that has successfully curtailed rampant fraud by attorneys and contractors. The company is also looking to expand into California, a market that has seen significant disruption following wildfires and poor regulatory oversight. We trimmed this large holding on strength during the quarter before adding more weight on a small recent pull-back.
DHI Group (“DHX”) operates a software subscription-based career marketplaces under its ClearanceJobs and Dice brands. The stock outperformed in the quarter as the company reported a pickup in hiring activity across its user base and announced another round of cost cuts that will provide a sizable boost to its margins. Even with the run-up in the share price, DHI continues to trade at a nice discount to fair value.
STRATTEC SECURITY (“STRT”) is a manufacturer of automotive locks, latches, power liftgates, and related access control systems. Shares outperformed during the quarter, supported by a continued rebound in global auto production and the company’s efforts to offset recent cost inflation. Management expects operating margins to normalize toward historical levels, which could further support share price appreciation. With the stock approaching our implied valuation, we have been gradually reducing our position while continuing to monitor fundamentals closely.
BuildABear Workshop (“BBW”) is a specialty retailer that offers an interactive “make your own stuffed animals” experience. After shares sold off a bit earlier this year over tariff concerns, the company assuaged fears in its most recent quarterly results, sending the stock to new highs. Pre-pandemic, BBW sourced nearly 100% of its materials from China. Today, that is less than 50% for US sales, with the majority shifted to Vietnam. Combined with some pre-tariff inventory purchases, steady margins, and optimism for capital-light partner growth, we share the enthusiasm beginning to get priced into BBW’s valuation.
Red Robin Gourmet Burgers (“RRGB”) is a family-friendly restaurant chain with nearly 500 locations. The stock has responded favorably to RRGB’s two financial results report releases this year, as it appears management is making progress on this turnaround situation. That said, the macro environment remains challenging for all but a few restaurant chains that have found the right “value offering” recipe, and RRGB shares will remain volatile to news in either direction, given its relatively high financial leverage. Near-term, we expect the company to focus on improving or closing underperforming locations and strengthening the balance sheet.
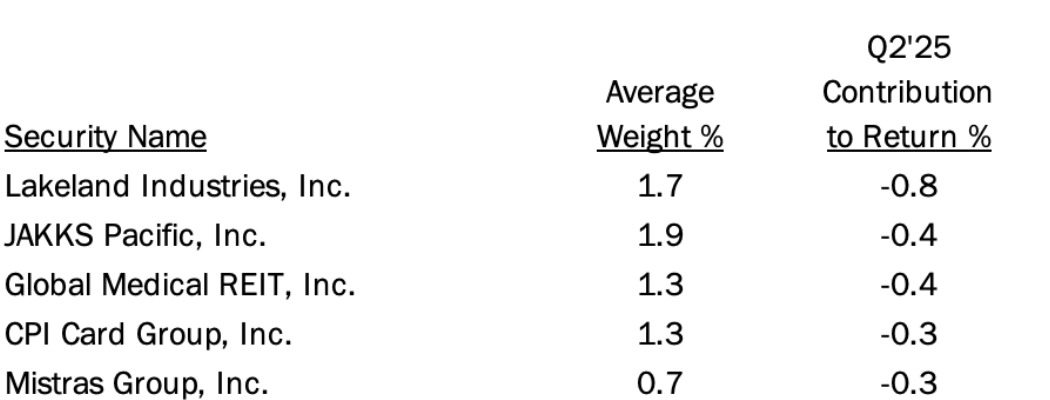
Top Detractors
Lakeland Industries (“LAKE”) designs, manufactures, and sells safety garments and accessories. Shares sold off in the quarter as the company reported results that were well short of expectations. Some delayed orders, one-time acquisition costs, and a temporary product mix shift caused a significant contraction in margins. We view this as a short-term hiccup and expect LAKE to regain its footing by year-end.
JAKKS Pacific (“JAKK”) is a maker of toys and costumes, with a significant portion of its revenue tied to long-term licenses with well-known media entertainment brands. JAKK shares sold off sharply on the initial announcement of 100% tariff on Chinese goods, with impacts on the entire toy industry supply chain. Shipments stopped for a month, which will likely impact June quarterly results. With lower 30% tariffs, however, the June-August key shipment season for Halloween costumes and inexpensive toys should return to normal. JAKK is very attractively valued with a single-digit PE, a cash-rich balance sheet, and nice dividend yield.
Global Medical REIT (“GMRE”) is a real estate investment trust focused on health care properties in secondary markets. The stock lagged during the quarter as the company is managing through a tenant bankruptcy and continued elevated interest rates. These factors led to a widely-expected dividend cut. That said, the recent appointment of a new CEO has been received positively by the market. In the near-term, GMRE is expected to deleverage, then expand when the cost of capital returns to an accretive level.
CPI Card Group (“PMTS”) is a manufacturer of payment cards in the US. The shares underperformed in the quarter after reporting a slight miss in results, largely due to an unfavorable product mix and some one-time start-up costs for a new facility. General uncertainty around the consumer spending environment was also a likely factor. We continued to add to our position on weakness as the share price is currently well below its implied value, trading at less than a 6x PE on estimates for next year.
Mistras Group (“MG”), a provider of asset inspection and testing services to the oil and gas, aerospace, industrial, and power infrastructure markets, missed expectations last quarter as growing economic uncertainty caused customer project delays and lower spending. However, recent cost reduction initiatives helped maintain operating profitability despite a 12% drop in revenue. Though management did not provide formal full-year guidance, it expects financial results to improve given the critical nature of its asset protection services. The shares are attractive at less than 6x cash flow and should get a further boost as MG continues to delever its balance sheet.
Market Review and Outlook
The second quarter of 2025 is best characterized as a period of volatility and uncertainty. It began with a major shock to capital markets as the tariffs proposed by the Trump administration on “Liberation Day” (April 2) far exceeded what had been previously expected. Equity markets quickly sold off, with the S&P 500 Index down 11.2% by April 8, which led to the Administration announcing a 90-day pause on some tariffs. The constant shift in policy and confusion around the eventual tariff levels and implementation timelines led to great uncertainty in the market.
This was compounded by geopolitical uncertainty surrounding the intensifying situation between Israel and Iran. Ultimately, the confidence that overly punitive tariffs would be delayed indefinitely, coupled with a de-escalation in the Middle East, helped spark a strong rally throughout the balance of the quarter, and the S&P 500 Index finished up 10.9% for the period. Global equity markets similarly posted robust returns.
After narrowly avoiding a recession last Fall through an improbable soft landing, economic data has been steady, if not robust. More recent quarterly GDP figures have not necessarily been reliable indicators given some pull forward activity as businesses sought to import goods in the first quarter ahead of tariff implementation. The labor market has been gradually cooling, evidenced by five straight months of contracting ISM Employment Index data through June. Numerous other measures of economic activity have been softening over the past several quarters. Additionally, President Trump has placed enormous pressure on Fed Chairman Powell to cut overnight rates, though uncertain trade policy and the potential inflationary impacts of tariffs have put the Fed Chair in a difficult position. Whether we tip into a recession or continue to proceed at below-trend growth is unclear.
If there is further economic deterioration, we are more concerned about the depth and duration of the downturn rather than the technical declaration of a recession or its timing. Currently, large cap and growth equity indices trade at stretched valuations and are vulnerable to a meaningful sell-off in the event of downward earnings revisions. That is where we see risk to the capital markets.
We will continue to focus on finding attractive companies with superior risk-adjusted returns in the Small and Micro Cap Value universe, targeting firms with strong balance sheets and a track record of free cash flow generation.
PRCP GIPS Report

*2021 Composite Dispersion excluding one account with a significant cash flow was 0.2%.
Disclosures
Pacific Ridge Capital Partners, LLC (“Pacific Ridge”, “PRCP”, or “the Firm”) is a 100% employee-owned investment advisor registered with the Securities and Exchange Commission under the Investment Advisors Act of 1940. The Firm was established in June 2010, and has one office located in Lake Oswego, Oregon. Pacific Ridge claims compliance with the Global Investment Performance Standards (GIPS®) and has prepared and presented this report in compliance with the GIPS standards. Pacific Ridge has been independently verified for the periods June 10, 2010 through March 31, 2025. A firm that claims compliance with the GIPS standards must establish policies and procedures for complying with all the applicable requirements of the GIPS standards. Verification provides assurance on whether the firm’s policies and procedures related to composite and pooled fund maintenance, as well as the calculation, presentation, and distribution of performance, have been designed in compliance with the GIPS standards and have been implemented on a firm-wide basis. The Micro Cap Value composite has had a performance examination for the periods June 10, 2010 through March 31, 2025. The verification and performance examination reports are available upon request.
The Micro Cap Value composite was created on June 10, 2010 and incepted on April 1, 2007. Performance from 2007 to 2010 is from portfolios managed at another entity. The Micro Cap Value composite comprises fully discretionary portfolios managed by the Firm invested primarily in a concentrated equity portfolio of smaller companies with market capitalizations similar to those found in the Russell Microcap® Index. Smaller capitalization equities have historically had greater volatility than large capitalization equities. The Strategy ascribes to a disciplined bottom-up fundamental selection process with an emphasis given to the cash flow generating capabilities of a company. The Strategy’s objective is to outperform the Russell Microcap Value Index which is used as our benchmark. Eligible portfolios must be managed for a full calendar month prior to inclusion in the Micro Cap Value composite. Composite dispersion is measured using an asset weighted standard deviation of gross returns of the portfolios included for the entire year. Returns and asset values are stated in US dollars.
The Russell Microcap Value Index measures the performance of the microcap segment of the U.S. equity market. For comparison purposes, the Index is fully invested, which includes the reinvestment of income. The return for the Index does not include any transaction costs, management fees or other costs. It is not possible to invest directly in the Index.
Sources: Pacific Ridge; FactSet Research Systems (“FactSet”); and Russell Investment Group (“Russell”) who is the source and owner of the Russell Index data.
Returns for the Micro Cap Value composite are time-weighted and presented gross and net of management fees and other expenses and includes realized and unrealized gains and losses, cash and cash equivalents and related interest income, and accrued based dividends. Net returns are calculated by deducting the highest annual management fee of 1.50% from the quarterly gross composite return. Performance-based fees are available upon request. All returns are calculated after the deduction of the actual transaction costs incurred during the period.
The fee schedule for separately managed accounts is a flat rate of 1.50%.
The portfolio characteristics, sector weightings and attribution analysis for the Micro Cap Value composite are based on a representative account within the Strategy. The representative account statistics are shown as supplemental information. The Firm maintains a complete list of contributors and detractors to portfolio return as well as a complete list and description of composites and pooled funds, policies for valuing portfolios, calculating performance, and preparing GIPS Reports, all of which are available upon request by contacting Peter Trumbo, Chief Operating Officer/Chief Compliance Officer at (503) 886-8972 or Peter.Trumbo@PacificRidgeCapital.com.
GIPS is a registered trademark of CFA Institute. CFA Institute does not endorse or promote this organization, nor does it warrant the accuracy or quality of the content contained herein.
Top and Bottom Performing Securities represent those security holdings that had the largest positive and negative total contribution to the portfolio return for the quarter. Top and Bottom Economic Sectors represent those sectors that had the largest positive and negative total contribution to the portfolio return. The holdings identified do not represent all the securities purchased, sold or recommended to clients.
In order to maintain consistency when comparing the Micro Cap Value strategy to the Russell benchmark, the Firm utilizes FactSet’s outlier methodology calculations which provide a comparable portfolio characteristic calculation methodology as Russell applies to its indices.
The information provided should not be considered a recommendation to purchase or sell any particular security. There is no assurance that any securities discussed herein will remain in the Strategy at the time you receive this report or that securities sold have not been repurchased. It should not be assumed that any of the holdings discussed herein were or will be profitable or that the investment recommendations or decisions we make in the future will be profitable or will equal the investment performance of the securities discussed herein. Past performance is no guarantee of future results.
Although the statements of fact and data in this report have been obtained from, and are based upon, sources that the Firm believes to be reliable, we do not guarantee their accuracy, and any such information may be incomplete or condensed. All opinions included in this report constitute the Firm’s judgment as of the date of this report and are subject to change without notice. This report is for informational purposes only and is not intended as an offer or solicitation with respect to the purchase or sale of any security.
| Investment Team | Other Professionals | |||
| Dominic Marshall, CFA® | Senior Portfolio Manager | Peter Trumbo | Chief Operating Officer/Chief Compliance Officer | |
| Mark Cooper, CFA | Portfolio Manager | Mike McDougall | Senior Trader | |
| Ryan Curdy, CFA | Portfolio Manager | Sharif Farag | Director of Investor Relations | |
| Justin McKillip, CFA | Senior Analyst | Veronica Orazio | Operations Assistant | |
| Adam Wilkie, CFA | Senior Analyst | |||
| Laura Moon, CFA | Analyst | |||
CFA® is a trademark owned by the CFA Institute. |
||||