

Performance Review
The Pacific Ridge Capital Partners Micro Cap Value strategy returned -12.9%* during the second quarter ended June 30, 2022, outperforming the Russell Microcap® Value Index (“Index”) return of -16.8%.

*For additional performance information, see the related GIPS® Report on the last page.
The strategy’s portfolio characteristics can be significantly different from the Index because we generally invest in smaller-sized and lower-valued stocks, as well as being sector indifferent. This difference is depicted in the charts below.
Size Analysis
The strategy benefitted from a modest size bias tailwind during the quarter as smaller companies in the Index outperformed larger companies. Those with a market capitalization below the $274 million Index median posted a -15.8% return, versus a -17.0% return for stocks with a market capitalization above the breakpoint level. The Index had 85.3% of its weight above the median market capitalization level and 14.7% below that level.

**The size breakpoint in the chart is based on the Index’s median market capitalization at the beginning of the period.
Style Analysis
The strategy benefitted from a moderate style bias tailwind during the quarter as unprofitable companies in the Index significantly underperformed profitable ones. The strategy held 9.1% in stocks with forward PEs lower than 0x, compared to 19.2% in the Index. The strategy also benefitted from a moderate style value bias tailwind by owning 65.7% in profitable stocks with PEs 0 - 15x.

*Companies that have no earnings estimates have been excluded, and thus the bars may not add up to 100%.
Sector Analysis
The top two contributing sectors to the strategy’s performance in the quarter were Industrials and Consumer Discretionary, with a combined benefit of nearly 210 basis points. These two sectors were overweight compared to the Index, resulting in a slight headwind that was more than offset by stock selection effect. The top two sector detractors were Financials and Utilities, combining for under 40 basis points of headwind. There was a small positive impact from being overweight in Financials, which performed better than other sectors in the Index. However, this positive impact was offset by stock selection effect.

Portfolio Characteristics (as of 6/30/22)

Top Contributors
Top Detractors
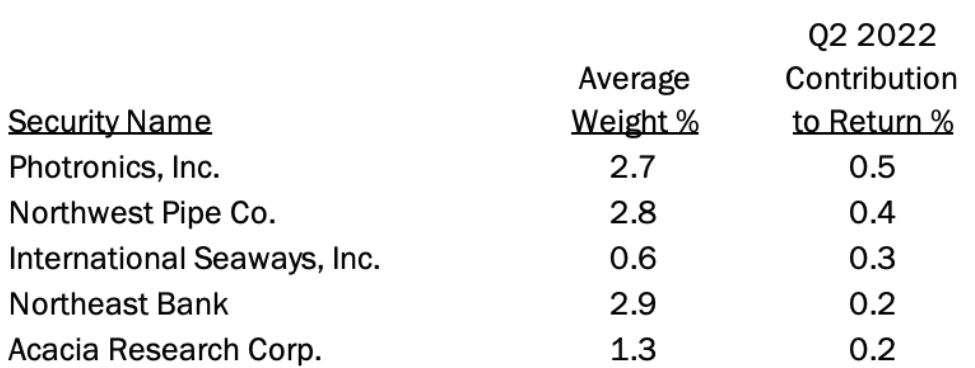

Top Contributors
Photronics, Inc. (“PLAB) is the leading merchant manufacturer of photomasks used in the production of semiconductors and flat panel displays. PLAB reported another good quarter of strong earnings results and management’s outlook was positive. The company is reaping the benefits of several years of heavy spending on capacity expansion, an investment that is now timely given the shortages in the semiconductor market. Despite a nice move in the shares, the valuation remains attractive and the balance sheet has ample cash reserves.
Northwest Pipe Company (“NWPX”) operates in two segments of the pipe market: the manufacture of large diameter steel pipes used in water transmission, and smaller precast infrastructure pipes used in residential construction and wastewater systems. Work delays and a slowdown in new business bidding activity during the pandemic significantly impacted NWPX. Presently, there is a sizable backlog of large-scale projects that need NWPX products. While it may take several years for funds from the bipartisan infrastructure bill to have an impact, it appears that the company is on the front end of a strong demand period.
International Seaways, Inc. (“INSW”), an owner and operator of an oil tanker fleet, reported results for the quarter that were ahead of expectations. The stock has performed well year-to-date because day rates for oil tankers have improved substantially. The recent strength in the stock gave an opportunity to exit our position during the quarter.
Northeast Bank (“NBN”) is a community bank and specialty lender based in Boston. The company reported solid earnings through its strategic partnerships and incrementally pivoted to take advantage of market conditions. When the economy is struggling, NBN buys scratch and dent loans at a discount from other banks at auctions. With some aspects of their business being countercyclical, NBN can grow its loan book throughout the business cycle. Its extensive underwriting and credit protections should shelter the company from material losses in a recessionary environment.
Acacia Research Corporation (“ACTG”) is a publicly traded, value-oriented investment manager of both private and public entities, with expertise in monetizing underutilized intellectual property assets. ACTG benefited from the ongoing monetization of a life sciences portfolio acquired at fire-sale pandemic prices. They also earned revenue from their collection of acquired patent portfolios (a recent WiFi 6 related settlement with Samsung). With financial backing from Starboard Value, ACTG continues to hunt for misunderstood assets to acquire, while the current portfolio continues to trade well below book value.
Top Detractors
Twin Disc, Incorporated (“TWIN”) is a manufacturer of power transmission equipment. TWIN gave back all the share price gains from last quarter, despite reporting favorable results for their quarter ending on March 31. Higher prices and a richer mix of sales drove profitability to the highest level in three years. Near term, margins are projected to hold and a 40% increase in sell side earnings is expected. While poor energy sentiment contributed to lackluster stock performance in the quarter, TWIN is currently benefiting from higher oil and gas activity and utilization by its customers.
Heritage Insurance (“HRTG”) is a property and casualty insurer. The company reported another disappointing quarter of earnings for Q1 2022. HRTG booked significantly higher reserves than expected due to a rise in weather-related losses. HRTG already had geographic exposure within Florida. Because of diversification initiatives over the past several years, the company now has additional exposure along the East Coast. The company is targeting an ambitious return on equity goal for 2023 of more than ten percent.
inTest (“INTT”) is a supplier of manufacturing and testing process solutions for a diversified set of customers, ranging from industrial and automotive to life sciences and semiconductor equipment. The stock appears to have been pulled down along with other semiconductor capital equipment vendors, given economic fears and perceived risk to the space. We believe the concern is overblown and misses the impact of changes brought by the new CEO to diversify the business and focus on non-technology growth areas.
Smith Micro Software, Inc. (“SMSI”) is a leader in family safety applications for the wireless carrier space. SMSI saw its shares decline in the quarter due to elevated expenses related to upcoming launches with multiple US cell phone providers now through the end of the year. T-Mobile officially launched its new family safety product using SMSI during the second quarter, with AT&T and Verizon onboarding this year. Though investors have grown tired of waiting, Sprint’s rollout of SMSI (before its acquisition by T-Mobile) demonstrates how quickly this high-margin business can improve the bottom line.
Metropolitan Bank Holding (“MCB”), a community bank based in New York City, sold off sharply during the quarter, along with several of its competitors. MCB has some minor business lines with exposure to cryptocurrencies and online banks that likely contributed to the sell-off. The bank remains highly profitable with excellent credit quality, and should benefit from an expanding net interest margin over the next several quarters.
Market Outlook
Stock market returns for the first six months of 2022 went into bear market territory for the second time since the pandemic. Growth stocks posted steeper losses than value stocks because of rising interest rates. Since March, the Federal Reserve raised its benchmark federal funds rate three times, from 0% to a range between 1.5% and 1.75%, including a 75 basis point rise in June—the largest increase in twenty-eight years.
This is also the first time in forty years that both bonds and stocks posted losses in two consecutive quarters. Heading into the second half of 2022, most investors are concerned about slowing economic growth and the threat of recession.
We continue to have a modest growth outlook for the US economy, though supply chain disruptions, inflationary pressures, and rising interest rates have led to a slowdown in the near-term. GDP was -1.6% in the first quarter, driven by decreased personal consumption and private inventory investment. A rise in Covid cases that triggered restrictions in parts of the US also hindered GDP. Expectations for GDP growth in the second quarter is forecasted at -2.0% on further deterioration of private domestic investment.
While sentiment amongst purchasing managers remains positive (the June 2022 US manufacturing PMI reading is at 53.0, the twenty-fifth consecutive month of expansion), several sub-components have weakened. For example, New Orders contracted after a 24-month run because of higher prices and extended lead times. However, for the month of June, the Labor Department reported that non-farm payrolls rose by 372,000, exceeding the 268,000 that economists had expected. Unemployment also remained at 3.6%, in line with estimates. Finally, the pace of deliveries has improved since last year, a sign that supply chain bottlenecks may be easing. These indicators show that the market outlook is mixed, supporting our forecast of modest economic growth.
PRCP GIPS Report

*Information is not statistically meaningful due to an insufficient number of portfolios in the composite for the entire year.
**2021 Composite Dispersion excluding one account with a significant cash flow was 0.2%.
Disclosures
Pacific Ridge Capital Partners, LLC (“Pacific Ridge”, “PRCP”, or “the Firm”) is a 100% employee owned investment advisor registered with the Securities and Exchange Commission under the Investment Advisors Act of 1940. The Firm was established in June 2010, and has one office located in Lake Oswego, Oregon. Pacific Ridge claims compliance with the Global Investment Performance Standards (GIPS®) and has prepared and presented this report in compliance with the GIPS standards. Pacific Ridge has been independently verified for the periods June 10, 2010 through March 31, 2022. A firm that claims compliance with the GIPS standards must establish policies and procedures for complying with all the applicable requirements of the GIPS standards. Verification provides assurance on whether the firm’s policies and procedures related to composite and pooled fund maintenance, as well as the calculation, presentation, and distribution of performance, have been designed in compliance with the GIPS standards and have been implemented on a firm-wide basis. The Micro Cap Value Composite has had a performance examination for the periods June 10, 2010 through March 31, 2022. The verification and performance examination reports are available upon request.
The Micro Cap Value composite was created on June 10, 2010 and incepted on April 1, 2007. The Micro Cap Value composite comprises fully discretionary portfolios managed by the Firm invested primarily in a concentrated equity portfolio of smaller companies with market capitalizations similar to those found in the Russell Microcap® Index. The strategy ascribes to a disciplined bottom-up fundamental selection process with an emphasis given to the cash flow generating capabilities of a company. The strategy’s objective is to outperform the Russell Microcap Value Index which is used as our benchmark. Eligible portfolios must be managed for a full calendar month prior to inclusion in the Micro Cap Value composite. Composite dispersion is measured using an asset weighted standard deviation of gross returns of the portfolios included for the entire year. Returns and asset values are stated in US dollars.
The Russell Microcap Value Index measures the performance of the microcap segment of the U.S. equity market. For comparison purposes, the index is fully invested, which includes the reinvestment of income. The return for the index does not include any transaction costs, management fees or other costs.
Sources: Pacific Ridge; FactSet Research Systems (“FactSet”); and Russell Investment Group (“Russell”) who is the source and owner of the Russell Index data.
Returns for the Micro Cap Value composite are presented gross and net of management fees and other expenses and includes realized and unrealized gains and losses, cash and cash equivalents and related interest income, and accrued based dividends. Net returns are calculated by deducting the highest annual management fee of 1.50% from the quarterly gross composite return. Performance-based fees are available upon request. All returns are calculated after the deduction of the actual transaction costs incurred during the period. The management fee schedule and total expense ratio for the Micro Cap Value Fund, which is included in the composite, are 1.50% on all assets and 1.56%, respectively, as of the most recent audit. Total fees for the fund may not exceed 1.75% annually.
The fee schedule for separately managed accounts is a flat rate of 1.50%.
The portfolio characteristics, sector weightings and attribution analysis for the Micro Cap Value composite are based on a representative account within the strategy. The representative account statistics are shown as supplemental information. The Firm maintains a complete list and description of composites and pooled funds, policies for valuing portfolios, calculating performance, and preparing GIPS Reports which are available upon request by contacting Peter Trumbo, Chief Operating Officer/Chief Compliance Officer at (503) 886-8972 or Peter.Trumbo@PacificRidgeCapital.com.
GIPS is a registered trademark of CFA Institute. CFA Institute does not endorse or promote this organization, nor does it warrant the accuracy or quality of the content contained herein.
Top 5 and Bottom 5 Performing Securities represent those security holdings that had the largest positive and negative total contribution to the portfolio return. Top 3 and Bottom 3 Economic Sectors represent those sectors that had the largest positive and negative total contribution to the portfolio return.
In order to maintain consistency when comparing the Micro Cap Value strategy to the Russell benchmark, the Firm utilizes FactSet’s outlier methodology calculations which provide a comparable portfolio characteristic calculation methodology as Russell applies to its indices.
The information provided should not be considered a recommendation to purchase or sell any particular security. There is no assurance that any securities discussed herein will remain in our strategy at the time you receive this report or that securities sold have not been repurchased. It should not be assumed that any of the holdings discussed herein were or will be profitable or that the investment recommendations or decisions we make in the future will be profitable or will equal the investment performance of the securities discussed herein. Past performance is no guarantee of future results.
Although the statements of fact and data in this report have been obtained from, and are based upon, sources that the Firm believes to be reliable, we do not guarantee their accuracy, and any such information may be incomplete or condensed. All opinions included in this report constitute the Firm’s judgment as of the date of this report and are subject to change without notice. This report is for informational purposes only and is not intended as an offer or solicitation with respect to the purchase or sale of any security.
| Investment Team | Other Professionals | |||
| Mark Cooper, CFA® | Co-Senior Portfolio Manager | Peter Trumbo | Chief Operating Officer/Chief Compliance Officer | |
| Dominic Marshall, CFA® | Co-Senior Portfolio Manager | Mike McDougall | Senior Trader | |
| Ryan Curdy, CFA® | Portfolio Manager | Manisha Thakkar, CFA® | Director of Business Development | |
| Justin McKillip, CFA® | Senior Analyst | Veronica Orazio | Operations Assistant | |
| Adam Wilke, CFA® | Senior Analyst | |||
| Laura Moon | Analyst |