

Q2'18 Micro Cap Value Strategy
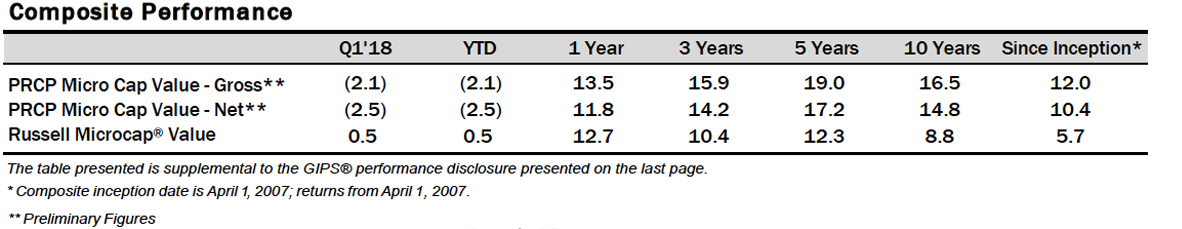
The Pacific Ridge Capital Partners’ Micro Cap Value strategy rose 11.1%* during the second quarter of 2018, outperforming the 10.2% return of the Russell Microcap® Value Index (“Index”). Over the trailing one-, three- and five-year periods, the strategy returned 21.3%*, 20.9%* and 19.3%* (annualized), respectively, compared to the Index returns of 20.7%, 13.7% and 13.5%. Since inception on April 1, 2007, the strategy has returned 12.8%* annually versus 6.5% for the Index.
Following seven rate increases by the Federal Reserve, the spread between long- and short-term interest rates has tightened considerably. Some commentators are pointing to the flattening yield curve as an indicator that economic growth may stagnate. While an inverted yield curve has preceded the last nine recessions, the timing and relationship to equity market movement is less precise. For example, in 1988, 1998, and 2006, the market rallied another 33%, 40%, and 22%, respectively, after the yield curve had already inverted. While the curve flattening gives us some concern over the intermediate- to long-term, nearly all other key indicators suggest strong economic growth in the near-term.
One of the key measures we continue to monitor is wage inflation. While the unemployment rate is near cyclical lows, meaningful wage growth has not materialized. In conversations with management teams, we hear of increasing signs of labor shortages. One CEO in the lodging industry stated that new employees are so difficult to find that he can no longer drug test applicants. “If you can fog a mirror with your breath,” he observed somewhat sardonically, “you can get a job.” This should, in theory, lead to increased wage inflation and pressure for additional rate increases. If the long-end of the yield curve remains low, it seems an inversion is a very real possibility at some point in the next year. While such a development would be disappointing, it is important to remember that the lag effect in the economy and markets can be as much as two years. A lot can happen in that time.
Second Quarter 2018
The Micro Cap Value strategy outperformed the Russell Microcap Value Index by approximately 100 basis points for the quarter. From a sector standpoint, the strategy’s strong performance in Industrials, Materials and Financials contributed approximately 250 basis points of excess return versus the Index. However, poor performance in Consumer Discretionary, Energy, and Information Technology detracted approximately 130 basis points versus the Index. The strategy’s lack of exposure to Consumer Staples, Telecommunications, and Utilities had a negligible impact to returns, relative to the Index.
There was a modest size bias headwind during the quarter, as larger companies in the Index outperformed smaller ones. Companies with a market cap between $500 million and $1 billion returned 12.7% versus 8.3% for companies with a market cap below $500 million. The strategy had 76.2% of its holdings in companies with a market cap below $500 million. In addition to size bias, a significant headwind arose from the strong performance of unprofitable companies in the Index, as they returned 15.7% versus a return of 8.9% for companies with a P/E greater than zero. The strategy had just 0.8% of its holdings in stocks with a P/E less than zero, versus 18.5% for the Index.
The Financials sector had the highest weight in the strategy at 33.0%, compared to the Index at 35.7%. The strategy’s holdings in the sector returned 8.5% for the period, compared to a return of 6.9% in the Index. The greatest contributor to performance was Premier Financial Bancorp (“PFBI”), with its shares returning 26.4% during the quarter. PFBI, a community bank headquartered in West Virginia, reported better than expected results for the first quarter, thanks to continued improvement of problem assets on their books and reduced operating expenses. With the improvement of its management metrics, the market has taken PFBI’s price multiples to levels that are more in-line with their peers. We continue to see a slight discrepancy between price and value and will continue to hold our shares until that gap closes.
Atlas Financial (“AFH”), a commercial auto insurer, was the greatest detractor to returns in the Financials sector, with its shares down 15.5% for the quarter. AFH reported several quarters of strong results throughout 2017 before announcing a massive reserve charge in the first quarter. While past reserving issues were largely confined to the Michigan market, this development was more broad-based. As expected, the company’s credit rating was downgraded last quarter, and though management has guided towards solid earnings for 2018, the market will likely keep AFH in the penalty box for some time.
Industrials was the second highest weighted sector in the strategy at 29.5% and is the greatest overweight compared to the Index at 12.4%. The strategy returned 14.2% in this sector during the period, compared to a gain of 8.9% in the Index. The greatest contributor to performance was DMC Global (“BOOM”), with its shares returning 67.9% during the quarter. BOOM, a manufacturer of oil field service equipment, continues to benefit from rapid growth in their end markets and overall market share gains. As energy prices recover, key customers continue to increase their investments in energy exploration. Because BOOM’s products increase the efficiency of their oil field investments, the company is also benefiting from increased pricing power.
NN, Inc. (“NNBR”) was the greatest detractor to returns in the Industrials sector, with its shares down 21.0% for the quarter. NNBR, a maker of high precision industrial, medical, and auto components, is undergoing a multi-year business transformation. They have made several acquisitions into higher-growth end markets that have less cyclicality. The stock has been pressured this year as results have been impacted by acquisition costs and up-front investments for new programs. If management can successfully execute their plan and decrease leverage, there should be significant upside to the stock price.
Information Technology was the third highest-weighted sector at 21.5%, compared to 8.0% in the Index. The strategy’s holdings in this sector returned 9.3% during the period, compared to a 14.6% gain in the Index. PCM Inc. (“PCMI”) was the greatest contributor to returns in the sector, with the shares returning 82.5% for the quarter. PCMI, a vendor of technology solutions, rebounded after several missed earnings reports that caused the stock to decline in value. Their latest earnings beat gave investors increased optimism that they will achieve their full year guidance. Record gross margins and strong results in their service business are boosting the company’s market value.
Quantum Corporation (“QTM”) was the greatest detractor to returns in the sector, with its shares down 39.6% for the quarter. QTM, a manufacturer of computer storage devices, originally sold off in early February when the company cancelled their earnings call and announced that they had received a subpoena from the SEC seeking information on revenue recognition issues dating back to 2016. The second quarter brought additional “bumps in the road” as the CEO resigned and the CFO was replaced. A new CEO with impressive industry experience was recently appointed, and the new CFO continues to bring the company current on their filings.
As always, we continue to search for companies that demonstrate an ability to earn a fair return on capital. We welcome any questions or comments you may have and thank you for your continued support.
Sincerely,
Pacific Ridge Capital Partners
*Returns are gross of fees and are preliminary
Note: Sector weights for the strategy and Index are the average for the period


Disclosures
Pacific Ridge Capital Partners, LLC (“Pacific Ridge”, “PRCP”, or “the Firm”) is a 100% employee owned investment advisor registered with the Securities and Exchange Commission under the Investment Advisors Act of 1940. The Firm was established in June 2010, and has one office located in Lake Oswego, Oregon. Pacific Ridge claims compliance with the Global Investment Performance Standards (GIPS®) and has prepared and presented this report in compliance with the GIPS standards. PRCP has been independently verified for the periods June 10, 2010 through March 31, 2018. Verification assesses whether (1) the Firm has complied with all the composite construction requirements of the GIPS standards on a firm-wide basis and (2) the Firm’s policies and procedures are designed to calculate and present performance in compliance with the GIPS standards. The Micro Cap Value composite has been examined for the periods June 10, 2010 through March 31, 2018. The verification and performance examination reports are available upon request.
The Micro Cap Value composite was created on June 10, 2010. The Micro Cap Value composite comprises fully discretionary portfolios managed by the Firm invested primarily in a concentrated equity portfolio of smaller companies with market capitalizations similar to those found in the Russell Microcap® Index. The strategy ascribes to a disciplined bottom-up fundamental selection process with an emphasis given to the cash flow generating capabilities of a company. The strategy’s objective is to outperform the Russell Microcap®Value Index which is used as our benchmark. Eligible portfolios must be managed for a full calendar month prior to inclusion in the Micro Cap Value composite. Prior to June 10, 2010 the performance represents the track record established by the Portfolio Management Team while affiliated with prior firms. The portability of the prior track record has been reviewed by Ashland Partners & Company LLP. Composite dispersion is measured using an asset weighted standard deviation of returns of the portfolios. Returns and asset values are stated in US dollars.
The Russell Microcap®Value Index measures the performance of the microcap segment of the U.S. equity market. For comparison purposes, the index is fully invested, which includes the reinvestment of income. The return for the index does not include any transaction costs, management fees or other costs.
Sources: Pacific Ridge; FactSet Research Systems (“FactSet”); and Russell Investment Group (“Russell”) who is the source and owner of the Russell Index data.
Returns for the Micro Cap Value composite are presented gross and net of management fees and other expenses and includes realized and unrealized gains and losses, cash and cash equivalents and related interest income, and accrued based dividends. Net returns are calculated by deducting the highest annual management fee of 1.50% from the quarterly gross composite return. All returns are calculated after the deduction of the actual trading expenses incurred during the period.
The management fee is a flat rate of 1.50%.
The portfolio characteristics, sector weightings and attribution analysis for the Micro Cap Value composite are based on a representative account within the strategy. The representative account statistics are shown as supplemental information. The Firm maintains a complete list and description of composites, policies for valuing portfolios, calculating performance, and preparing compliant presentations which are available upon request by contacting Peter Trumbo, Chief Compliance Officer at (503) 886-8972 or Peter.Trumbo@PacificRidgeCapital.com.
Top 5 and Bottom 5 Performing Securities represent those security holdings that had the largest positive and negative total contribution to the portfolio return. Top 3 and Bottom 3 Economic Sectors represent those sectors that had the largest positive and negative total contribution to the portfolio return.
In order to maintain consistency when comparing the Micro Cap Value strategy to the Russell benchmark, the Firm utilizes FactSet’s outlier methodology calculations which provide a comparable portfolio characteristic calculation methodology as Russell applies to its indices.
The information provided should not be considered a recommendation to purchase or sell any particular security. There is no assurance that any securities discussed herein will remain in our strategy at the time you receive this report or that securities sold have not been repurchased. It should not be assumed that any of the holdings discussed herein were or will be profitable or that the investment recommendations or decisions we make in the future will be profitable or will equal the investment performance of the securities discussed herein. Past performance is no guarantee of future results.
Although the statements of fact and data in this report have been obtained from, and are based upon, sources that the Firm believes to be reliable, we do not guarantee their accuracy, and any such information may be incomplete or condensed. All opinions included in this report constitute the Firm’s judgment as of the date of this report and are subject to change without notice. This report is for informational purposes only and is not intended as an offer or solicitation with respect to the purchase or sale of any security.