

Q2'17 Small Cap Value Strategy
The Pacific Ridge Capital Partners (“PRCP”) Small Cap Value strategy rose 0.4%* in the second quarter of 2017, slightly behind the 0.7% return for the Russell 2000® Value Index (“Index”). Over the trailing one-, three-, and five-year periods, the strategy returned 35.8%*, 8.1%*, and 15.8%* (annualized), respectively, compared to the Index returns of 24.9%, 7.0%, and 13.4%. Since inception on August 1, 2010, the strategy has returned 14.5%* annually versus 12.6% for the Index.
Last quarter, we noted the divergence in expectations for economic growth, ranging from an optimistic 3% forecast (based on “soft” survey data) down to a more pessimistic 1% growth rate (based on “hard” survey data). The more pessimistic outlook from the Atlanta Federal Reserve ended up being more accurate, with first quarter GDP growth reported at 1.4%. The Atlanta Federal Reserve’s economic outlook is more favorable for the second quarter, with a forecasted rebound to 3% growth. Based on our casual observations of the local labor market, this is not too surprising. Though the economy currently appears to be strong, we are careful not to extrapolate this too far into the future.
Second Quarter 2017
For the quarter, the Small Cap Value strategy lagged the Russell 2000 Value Index by approximately 30 basis points. In the Index, those stocks with a market cap less than $1 billion returned 1.6% during the quarter, while those with a market cap greater than $1 billion returned 0.3%. This small size bias typically favors the strategy with 72% of its weight made up of companies under $1 billion compared to 26% in the Index. However, poor stock selection caused the strategy to underperform, with its sub-$1 billion holdings falling 0.6% during the period. Strong stock selection from holdings greater than $1 billion, with those stocks returning 2.8% in the strategy, helped offset some but not all of the smaller stock underperformance.

Within both the Index and our strategy, stocks with lower P/E ratios performed slightly better than those with higher P/Es. The strategy also benefited from being overweight in lower P/E stocks relative to the Index. For the Index, stocks with lower betas performed slightly better than high beta stocks.
From a sector standpoint, the strategy’s performance in Industrials and Information Technology contributed nearly 200 basis points of excess return versus the Index. However, poor performance in both Consumer Discretionary and Financials detracted nearly 200 basis points versus the Index. Our underweight position in the Energy sector contributed 50 basis points of excess return versus the Index because it was the worst performing sector in the Index.
Industrials remained the highest weighted sector in the strategy at 29.1% and had the greatest overweight compared to the Index at 13.4%. The strategy’s holdings in the sector returned 7.1% in the period, compared to a 5.2% gain in the Index. The greatest contributor to performance was CAI International (“CAI”), with its shares returning 49.9% in the quarter. CAI, an intermodal freight container leasing and management company, rallied in April following strong fiscal second quarter results and signs that industry trends were improving faster than anticipated. The stock continued to do well in June as the company preannounced results suggesting that the improved environment should continue into the back half of the year.
Acacia Research (“ACTG”) was the greatest detractor to returns in the Industrials sector, with its shares down 28.7% in the quarter. ACTG, a licensor and enforcer of technology patents, reported a quiet quarter of earnings, with revenue below expectations resulting from few announced settlements. However, there are two large outstanding willful infringement verdicts that, if ruled in ACTG’s favor, could provide a tailwind for the stock. Also, late in the second quarter, the company announced two new licensing deals with ZTE and Medtronic. Though results for this company tend to be volatile from quarter-to-quarter (making short-term forecasting difficult), we continue to maintain our position given our long-term focus.
Information Technology was the second highest weighted sector in the strategy at 24.0%, compared to 10.0% in the Index. The strategy’s holdings in this sector returned 4.0% during the period, compared to a gain of 0.8% in the Index. Novanta (“NOVT”), a manufacturer of precision laser and motion control systems, was the greatest contributor to returns in the sector, with shares up 35.6%. NOVT has performed well over the past year, having reported strong revenue growth both organically and through acquisitions. As a result, earnings estimates have seen positive revisions given the company’s successful leverage of their SG&A expenses.
Meet Group (“MEET”) was the greatest detractor to returns in the sector, with its shares down 14.3% during the period. MEET, a social-networking company, gave up gains from earlier in the year following disappointing earnings guidance. Historical comparisons and forecasting have become more difficult because the company has simultaneously completed multiple acquisitions and a capital raise. With the introduction of live video and the potential for improving the revenue model for recently acquired properties, we have added to our position.
Financials was the third highest weighted sector in the strategy at 20.9%, and had the greatest underweight compared to the Index at 32.0%. The strategy’s performance in this sector fell 2.9% during the period, compared to a 1.1% gain in the Index. Third Point Reinsurance (“TPRE”) was the greatest contributor to returns in the sector, with the shares returning 14.9% in the quarter. TPRE, a property and casualty reinsurer, performed well following commentary during their quarterly conference call suggesting they will be less aggressive writing new premiums. (This implies lower future underwriting losses.) Strong investment results, the primary driver of their earnings and stock price, have also provided a tailwind.
Ocwen Financial (“OCN”) was the greatest detractor to returns in the sector, with the shares down 55.8% in the quarter. OCN, a mortgage originator and servicer, fell over 50% in April following a cease-and-desist order from the North Carolina Commissioner of Banks due to mishandled escrow accounts. That same day, the CFPB filed a lawsuit accusing OCN of similar errors and improperly foreclosing on struggling borrowers. Due to concerns that the Company would quickly burn through their remaining capital addressing regulatory concerns we decided to promptly exit our position.
As always, we continue to search for companies that demonstrate an ability to earn a fair return on capital. We welcome any questions or comments you may have, and thank you for your continued support.
Sincerely,
Pacific Ridge Capital Partners
*Returns are preliminary
Note: Sector weights for the strategy and Index are the average for the period

Disclosures
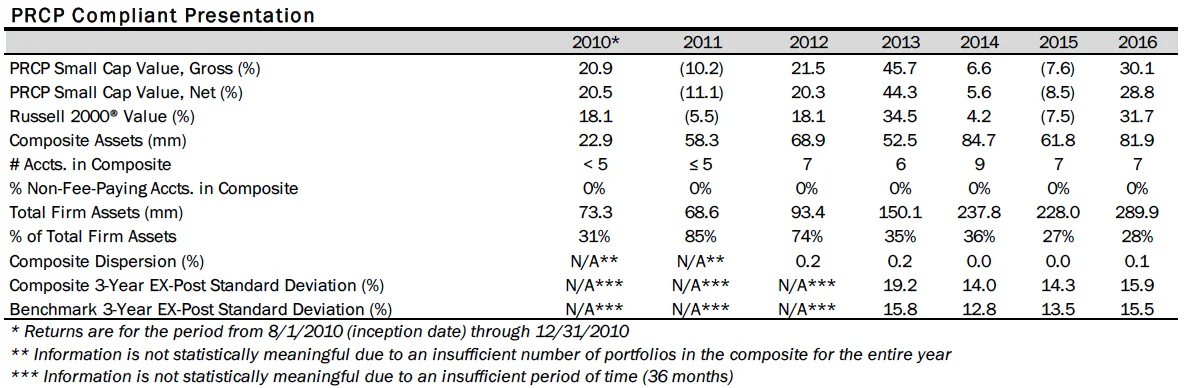
Pacific Ridge Capital Partners, LLC (“Pacific Ridge”, “PRCP”, or “the Firm”) is a 100% employee owned investment advisor registered with the Securities and Exchange Commission under the Investment Advisors Act of 1940. The Firm was established in June 2010, and has one office located in Lake Oswego, Oregon. Pacific Ridge claims compliance with the Global Investment Performance Standards (GIPS®) and has prepared and presented this report in compliance with the GIPS standards. PRCP has been independently verified for the periods June 10, 2010 through March 31, 2017. Verification assesses whether (1) the Firm has complied with all the composite construction requirements of the GIPS standards on a firm-wide basis and (2) the Firm’s policies and procedures are designed to calculate and present performance in compliance with the GIPS standards. The Small Cap Value composite has been examined for the periods August 1, 2010 through March 31, 2017. The verification and performance examination reports are available upon request.
The Small Cap Value composite was created on August 1, 2010. The Small Cap Value composite comprises fully discretionary portfolios managed by the Firm invested primarily in an equity portfolio of small companies with market capitalizations similar to those found in the bottom three-quarters of the Russell 2000® Index. The strategy ascribes to a disciplined bottom-up fundamental selection process with an emphasis given to the cash flow generating capabilities of a company. The strategy’s objective is to outperform the Russell 2000® Value Index which is used as our benchmark. Eligible portfolios must be managed for a full calendar month prior to inclusion in the Small Cap Value composite. Composite dispersion is measured using an asset weighted standard deviation of returns of the portfolios. Returns and asset values are stated in US dollars.
The Russell 2000® Value Index measures the performance of the Russell 2000 companies with lower price-to-book ratios and lower forecasted growth values. For comparison purposes, the index is fully invested, which includes the reinvestment of income. The return for the index does not include any transaction costs, management fees or other costs.
Sources: Pacific Ridge; FactSet Research Systems (“FactSet”); and Russell Investment Group (“Russell”) who is the source and owner of the Russell Index data.
Returns for the Small Cap Value composite are presented gross and net of management fees and other expenses and includes realized and unrealized gains and losses, cash and cash equivalents and related interest income, and accrued based dividends. Net returns are calculated by deducting the highest annual management fee of 1.00% from the quarterly gross composite return. All returns are calculated after the deduction of the actual trading expenses incurred during the period.
The management fee is a flat rate of 1.00%.
The portfolio characteristics, sector weightings and attribution analysis for the Small Cap Value composite are based on a representative account within the strategy. The representative account statistics are shown as supplemental information. The Firm maintains a complete list and description of composites, policies for valuing portfolios, calculating performance, and preparing compliant presentations which are available upon request by contacting Peter Trumbo, Chief Compliance Officer at (503) 886-8972 or Peter.Trumbo@PacificRidgeCapital.com.
Top 5 and Bottom 5 Performing Securities represent those security holdings that had the largest positive and negative total contribution to the portfolio return. Top 3 and Bottom 3 Economic Sectors represent those sectors that had the largest positive and negative total contribution to the portfolio return.
In order to maintain consistency when comparing the Small Cap Value strategy to the Russell benchmark, the Firm utilizes FactSet’s outlier methodology calculations which provide a comparable portfolio characteristic calculation methodology as Russell applies to its indices.
The information provided should not be considered a recommendation to purchase or sell any particular security. There is no assurance that any securities discussed herein will remain in our strategy at the time you receive this report or that securities sold have not been repurchased. It should not be assumed that any of the holdings discussed herein were or will be profitable or that the investment recommendations or decisions we make in the future will be profitable or will equal the investment performance of the securities discussed herein. Past performance is no guarantee of future results.
Although the statements of fact and data in this report have been obtained from, and are based upon, sources that the Firm believes to be reliable, we do not guarantee their accuracy, and any such information may be incomplete or condensed. All opinions included in this report constitute the Firm’s judgment as of the date of this report and are subject to change without notice. This report is for informational purposes only and is not intended as an offer or solicitation with respect to the purchase or sale of any security.