

Q2'17 Micro Cap Value Strategy
The Pacific Ridge Capital Partners (“PRCP”) Micro Cap Value strategy rose 4.0%* in the second quarter of 2017, ahead of the 2.9% return for the Russell Microcap® Value Index (“Index”). Over the trailing one-, three-, and five-year periods, the strategy returned 47.1%*, 17.2%*, and 21.9%* (annualized), respectively, compared to the Index returns of 31.3%, 8.0%, and 14.4%. Since inception on April 1, 2007, the strategy has returned 12.0%* annually versus 5.2% for the Index.
Last quarter, we noted the divergence in expectations for economic growth, ranging from an optimistic 3% forecast (based on “soft” survey data) down to a more pessimistic 1% growth rate (based on “hard” survey data). The more pessimistic outlook from the Atlanta Federal Reserve ended up being more accurate, with first quarter GDP growth reported at 1.4%. The Atlanta Federal Reserve’s economic outlook is more favorable for the second quarter, with a forecasted rebound to 3% growth. Based on our casual observations of the local labor market, this is not too surprising. Though the economy currently appears to be strong, we are careful not to extrapolate this too far into the future.
Second Quarter 2017
For the quarter, the Micro Cap Value strategy delivered just over 100 basis points of excess return versus the Russell Microcap Value Index. Although the strategy outperformed its benchmark, there was a moderate headwind due to size bias, given that larger market cap segments outperformed smaller ones. In the Russell Microcap Value, stocks with a market cap below $400 million returned 2.5%, while those with a market cap greater than $400 million returned 3.2%.
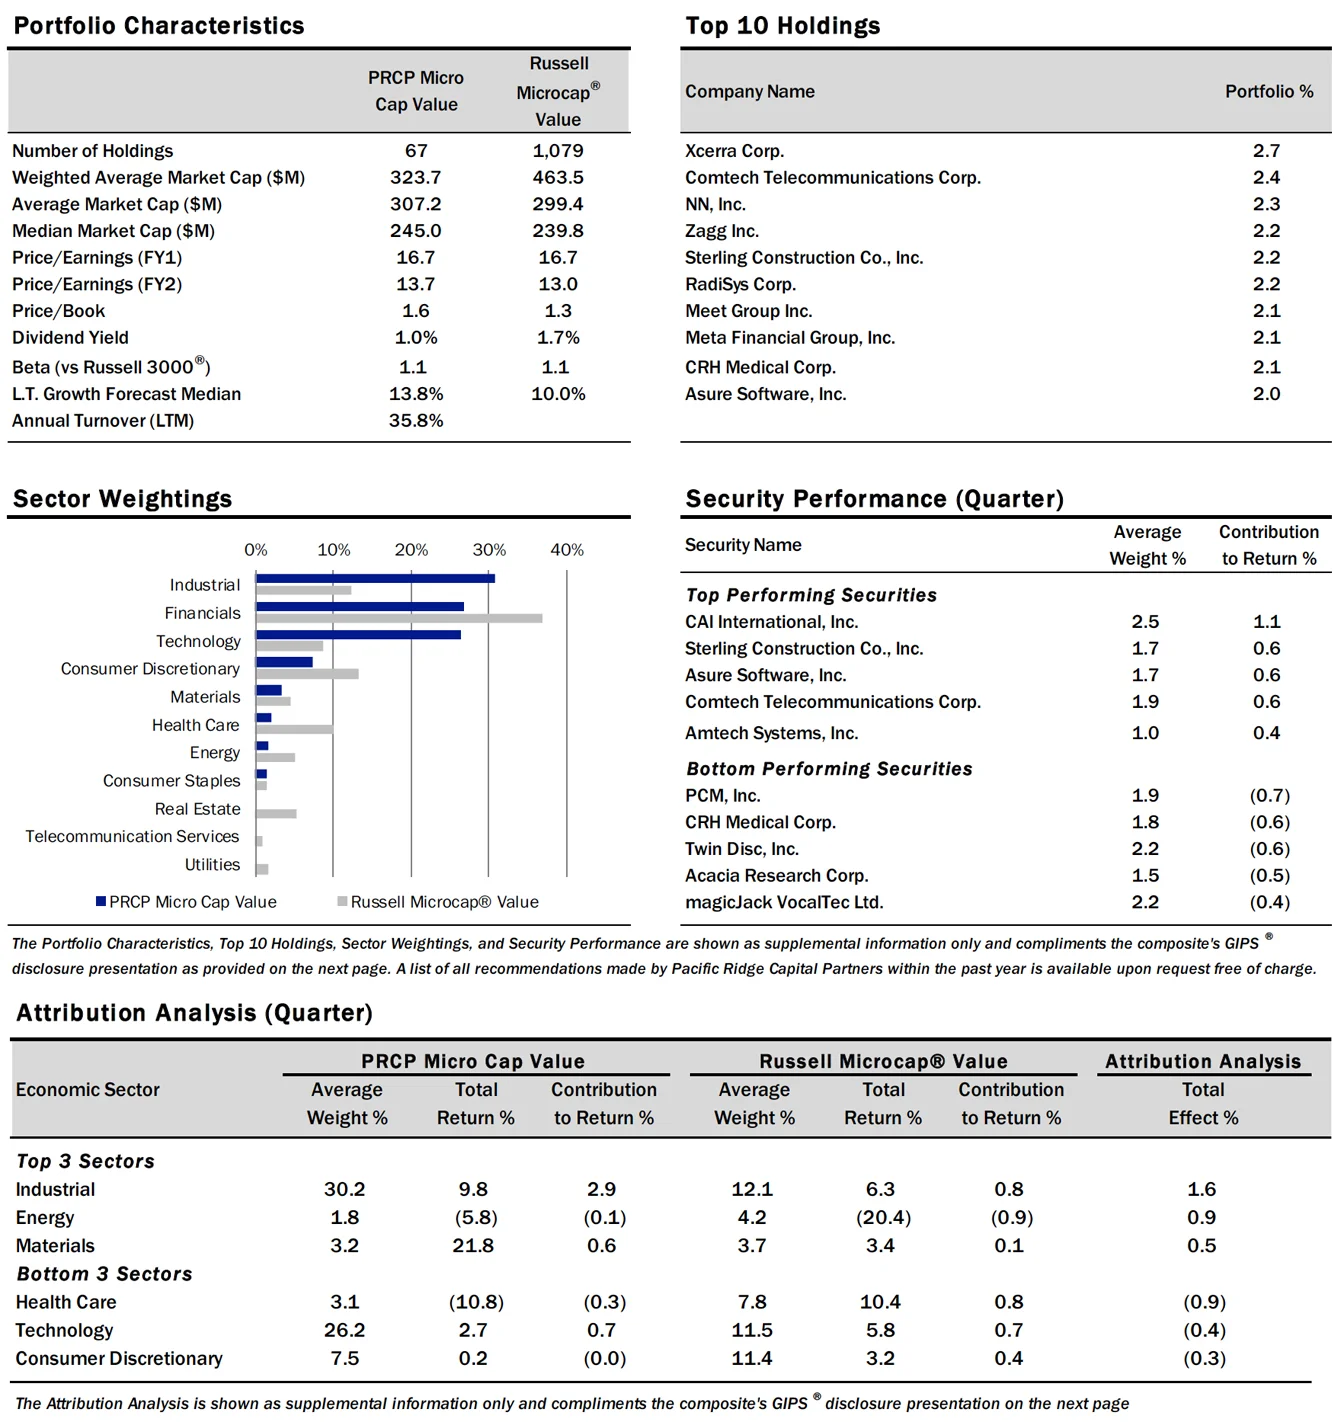
From a sector standpoint, the strategy’s strong performance in Industrials and Energy contributed approximately 250 basis points of excess return versus the Index. However, poor performance in Health Care and Information Technology detracted about 130 basis points versus the Index. The lack of exposure to Real Estate, Telecommunications, and Utilities within the strategy created a minor headwind and detracted about 20 basis points versus the Index.

Industrials remained the highest weighted sector in the strategy at 30.2%, and is the greatest overweight compared to the Index at 12.1%. The strategy’s holdings in the sector returned 9.8% in the period, compared to a return of 6.3% in the Index. The greatest contributor to performance in the sector was CAI International (“CAI”), with its shares returning 49.9% in the quarter. CAI, an intermodal freight container leasing and management company, rallied in April following strong fiscal second quarter results and signs that industry trends were improving faster than anticipated. The stock continued to do well in June as the company preannounced results suggesting that the improved environment should continue into the back half of the year. Though we recently trimmed our position, we continue to hold CAI as it still trades below what we feel is fair value.
Twin Disc (“TWIN”), a manufacturer of power transmission equipment, was the greatest detractor to returns in the Industrials sector, with its shares down 21.5% in the quarter. TWIN reported solid earnings in early May, but commentary from management was more cautious surrounding visibility into the next fiscal year. With the energy industry as their primary end market, the stock continued to weaken as oil prices fell sharply to their lowest level of the year. Management has done a good job of maintaining a clean balance sheet and limiting their capital spending during the downturn. Given the operating leverage in TWIN’s model, the stock should do well with a sustained recovery in energy prices.
Financials was the second highest weighted sector in the strategy at 26.6% and had the greatest underweight compared to the Index at 40.0%. The strategy’s holdings in this sector increased 1.2% during the period, compared to a return of 1.6% in the Index. Northeast Bancorp (“NBN”), a community bank operating in Southwest Maine, was the greatest contributor to returns in the sector, with its shares up 33.1%. NBN’s unique business model utilizes funding from their community bank franchise to purchase commercial real estate loans at a discount to par. The stock is a new addition to the strategy and has performed well as earnings beat the lone estimate in late April. The addition to the Russell 2000 Index provided a further tailwind.
MidSouth Bancorp (“MSL”) was the greatest detractor, with its shares down 22.6% during the period. MSL, a community bank headquartered in Louisiana, announced a capital raise in June that was larger than anticipated. Proceeds are intended to pay off preferred securities and cover an increased provision. The disappointing news on the credit front was exacerbated by management cutting the dividend and announcing that their primary regulator may designate them as being in “troubled condition.” Despite these setbacks, the stock currently trades at tangible book value and management continues their turnaround strategy. As such, we continue to maintain our position in MSL.
Information Technology was the third highest weighted sector at 26.2%, compared to 11.5% in the Index. The strategy’s holdings in this sector returned 2.7% during the period, compared to a 5.8% gain in the Index. Asure Software (“ASUR”) was the greatest contributor to returns in the sector, with the shares returning 42.1% in the quarter. ASUR is a provider of workforce management software. The stock rallied during the quarter as they reported strong earnings, announced two acquisitions and completed an equity raise. The company’s shift to a recurring revenue model is positively impacting their results, with the acquisitions providing an additional boost. We are pleased with management’s efforts to expand their addressable market and drive operating leverage.
PCM, Inc. (“PCMI”) was the greatest detractor to returns in the Information Technology sector, with shares down 33.2% in the quarter. PCMI, a vendor of technology solutions, sold off sharply following a short report written about the company that alleged a number of troubling accusations. After a discussion with management, we feel comfortable that the report contained factual errors and many of the charges were baseless. While there are changes we would like to see the company make (e.g., increasing the size of the Board), we disagree with the underlying premise of the report and remain confident in the long-term performance of the shares.
As always, we continue to search for companies that demonstrate an ability to earn a fair return on capital. We welcome any questions or comments you may have, and thank you for your continued support.
Sincerely,
Pacific Ridge Capital Partners
*Returns are preliminary
Note: Sector weights for the strategy and Index are the average for the period

Disclosures
Pacific Ridge Capital Partners, LLC (“Pacific Ridge”, “PRCP”, or “the Firm”) is a 100% employee owned investment advisor registered with the Securities and Exchange Commission under the Investment Advisors Act of 1940. The Firm was established in June 2010, and has one office located in Lake Oswego, Oregon. Pacific Ridge claims compliance with the Global Investment Performance Standards (GIPS®) and has prepared and presented this report in compliance with the GIPS standards. PRCP has been independently verified for the periods June 10, 2010 through March 31, 2017. Verification assesses whether (1) the Firm has complied with all the composite construction requirements of the GIPS standards on a firm-wide basis and (2) the Firm’s policies and procedures are designed to calculate and present performance in compliance with the GIPS standards. The Micro Cap Value composite has been examined for the periods June 10, 2010 through March 31, 2017. The verification and performance examination reports are available upon request.
The Micro Cap Value composite was created on June 10, 2010. The Micro Cap Value composite comprises fully discretionary portfolios managed by the Firm invested primarily in a concentrated equity portfolio of smaller companies with market capitalizations similar to those found in the Russell Microcap® Index. The strategy ascribes to a disciplined bottom-up fundamental selection process with an emphasis given to the cash flow gener-ating capabilities of a company. The strategy’s objective is to outperform the Russell Microcap® Value Index which is used as our benchmark. Eligible portfolios must be managed for a full calendar month prior to inclusion in the Micro Cap Value composite. Prior to June 10, 2010 the performance represents the track record established by the Portfolio Management Team while affiliated with prior firms. The portability of the prior track record has been reviewed by Ashland Partners & Company LLP. Composite dispersion is measured using an asset weighted standard deviation of returns of the portfolios. Returns and asset values are stated in US dollars.
The Russell Microcap® Value Index measures the performance of the microcap segment of the U.S. equity market. For comparison purposes, the index is fully invested, which includes the reinvestment of income. The return for the index does not include any transaction costs, management fees or other costs.
Sources: Pacific Ridge; FactSet Research Systems (“FactSet”); and Russell Investment Group (“Russell”) who is the source and owner of the Russell Index data.
Returns for the Micro Cap Value composite are presented gross and net of management fees and other expenses and includes realized and unrealized gains and losses, cash and cash equivalents and related interest income, and accrued based dividends. Net returns are calculated by deducting the highest annual management fee of 1.50% from the quarterly gross composite return. All returns are calculated after the deduction of the actual trading expenses incurred during the period.
The management fee is a flat rate of 1.50%.
The portfolio characteristics, sector weightings and attribution analysis for the Micro Cap Value composite are based on a representative account within the strategy. The representative account statistics are shown as supplemental information. The Firm maintains a complete list and description of composites, policies for valuing portfolios, calculating performance, and preparing compliant presentations which are available upon request by contacting Peter Trumbo, Chief Compliance Officer at (503) 886-8972 or Peter.Trumbo@PacificRidgeCapital.com.
Top 5 and Bottom 5 Performing Securities represent those security holdings that had the largest positive and negative total contribution to the portfolio return. Top 3 and Bottom 3 Economic Sectors represent those sectors that had the largest positive and negative total contribution to the portfolio return.
In order to maintain consistency when comparing the Micro Cap Value strategy to the Russell benchmark, the Firm utilizes FactSet’s outlier methodology calculations which provide a comparable portfolio characteristic calculation methodology as Russell applies to its indices.
The information provided should not be considered a recommendation to purchase or sell any particular security. There is no assurance that any securities discussed herein will remain in our strategy at the time you receive this report or that securities sold have not been repurchased. It should not be assumed that any of the holdings discussed herein were or will be profitable or that the investment recommendations or decisions we make in the future will be profitable or will equal the investment performance of the securities discussed herein. Past performance is no guarantee of future results.
Although the statements of fact and data in this report have been obtained from, and are based upon, sources that the Firm believes to be reliable, we do not guarantee their accuracy, and any such information may be incomplete or condensed. All opinions included in this report constitute the Firm’s judgment as of the date of this report and are subject to change without notice. This report is for informational purposes only and is not intended as an offer or solicitation with respect to the purchase or sale of any security.