

Performance Review
The Pacific Ridge Capital Partners Small Cap Value strategy (the “Strategy”) returned -9.1%* (-9.3%* net of fees) during the first quarter ended March 31, 2025, underperforming the Russell 2000® Value Index (the “Index”) return of -7.7%. For the trailing twelve-month period, the Strategy returned -1.9%* (-2.9%* net of fees), outperforming the Index return of -3.1%.
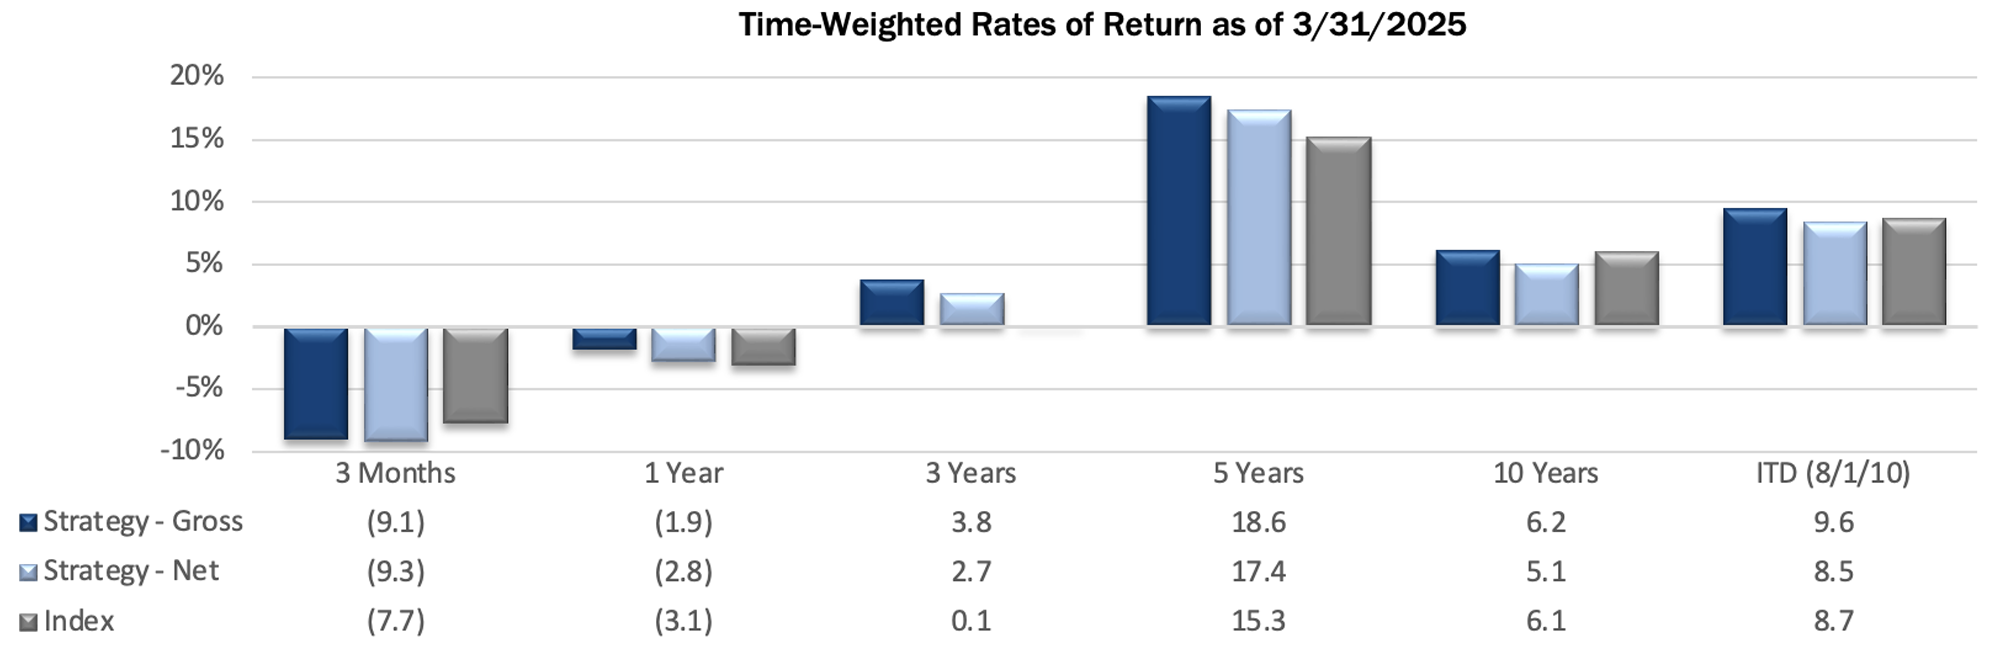
*For additional performance information, see the related GIPS® Report below.
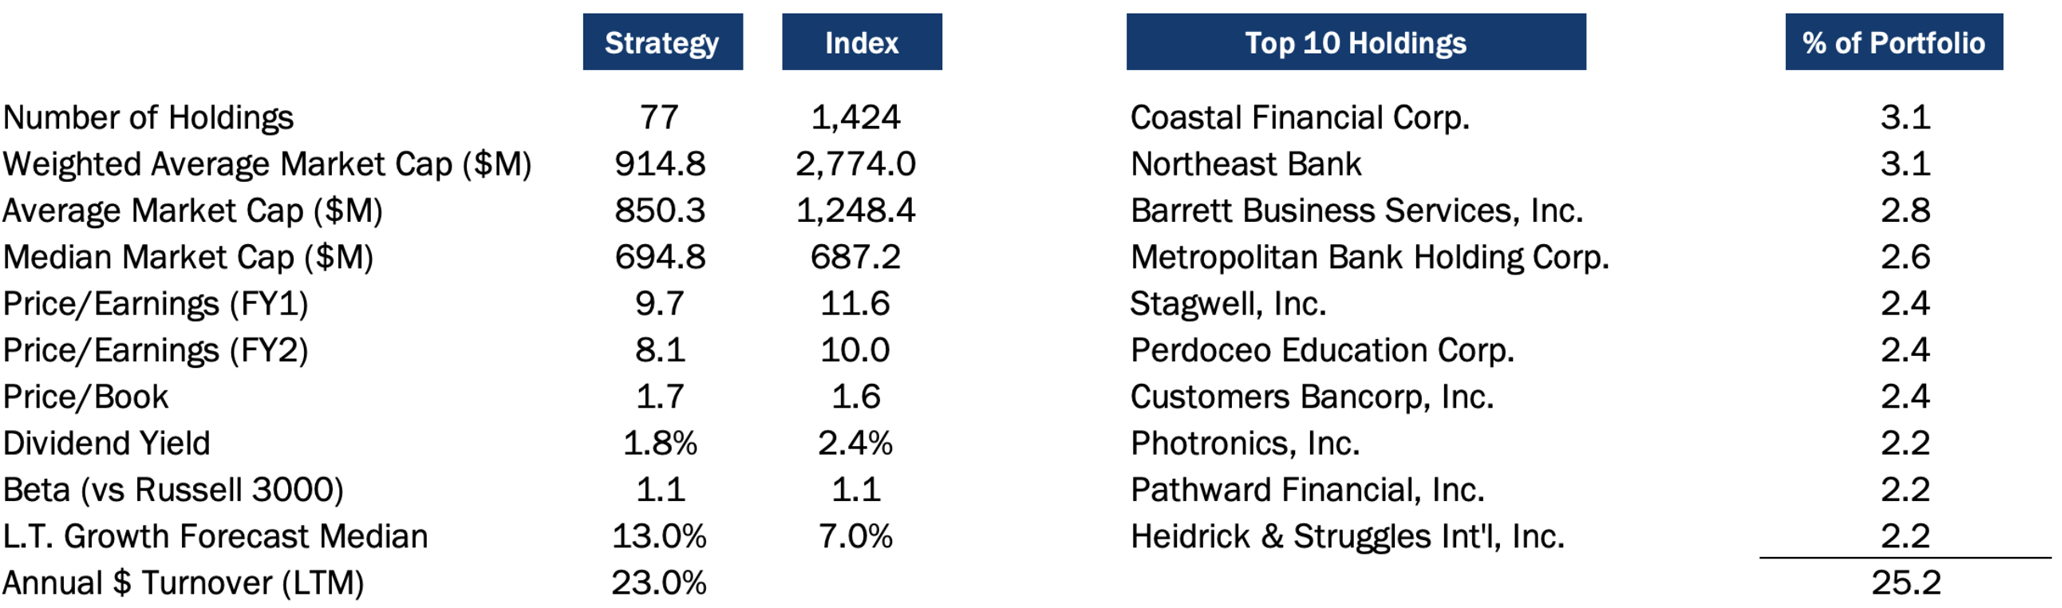
The Strategy’s portfolio characteristics can be significantly different from the Index because we primarily invest in smaller, undervalued stocks and adopt a sector-agnostic approach. You can see these distinctions in the charts below.
Size Analysis
During the quarter, the Strategy faced a moderate headwind due to its size bias, as smaller companies underperformed their larger counterparts within the Index. Companies with market capitalizations below the Index median of $794 million returned -12.2%, trailing the -7.0% return of those above the median. The Index had 13.8% of its weight to companies below the median, while the Strategy allocated a significantly higher 46.6%.
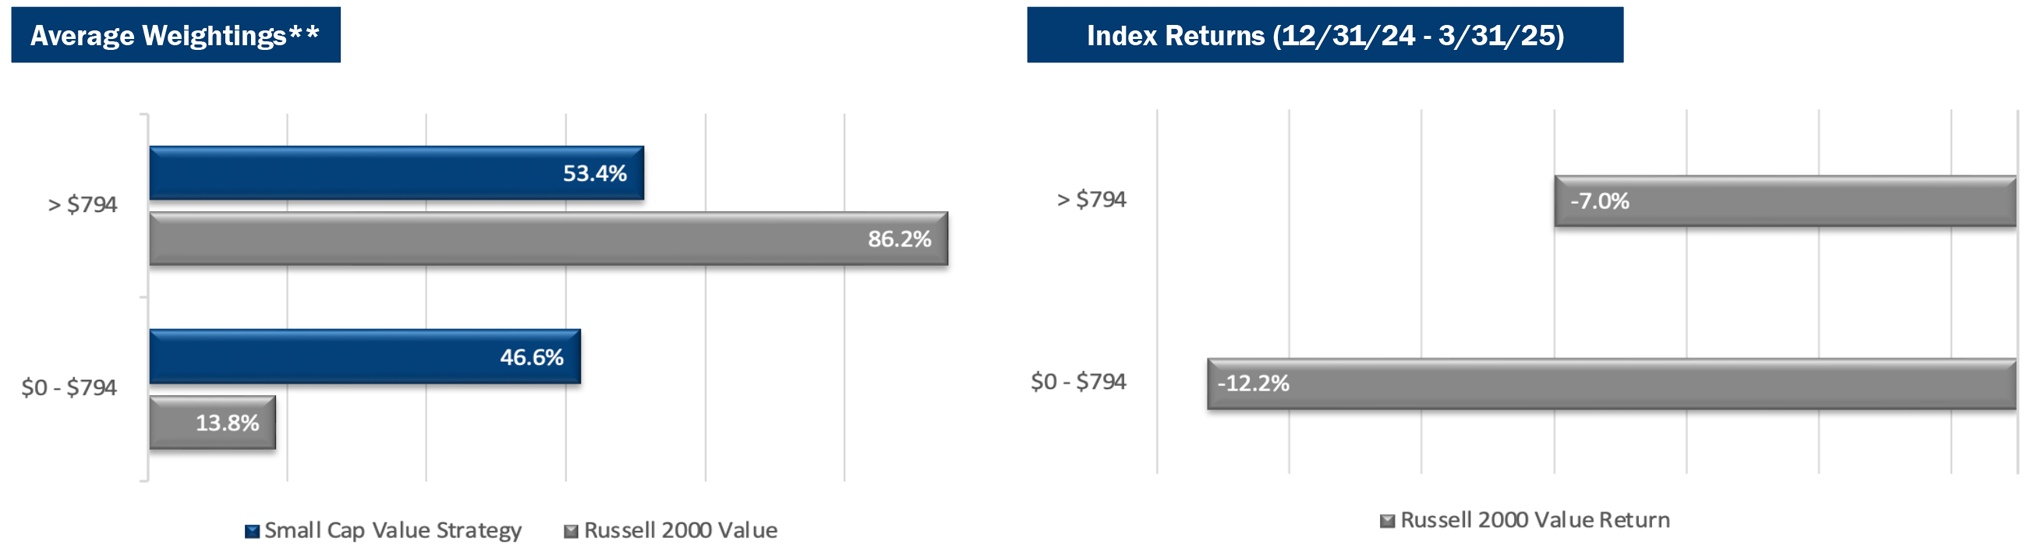
**The size breakpoint in the chart is based on the Index’s median market capitalization at the beginning of the period.
Style Analysis
The Strategy benefited from a modest style bias tailwind during the quarter. This was primarily due to its smaller exposure to unprofitable companies (PE ratio below 0x), which were the worst-performing segment in the Index with a return of -15.8%. The Index had a 13.0% weighting, compared to just 5.4% for the Strategy. Profitable companies with lower valuations (PE ratio below 15x) posted the second- weakest return of -6.9%, but the Strategy’s overweight position at 66.4% (versus 49.2% in the Index) had a slight performance benefit.
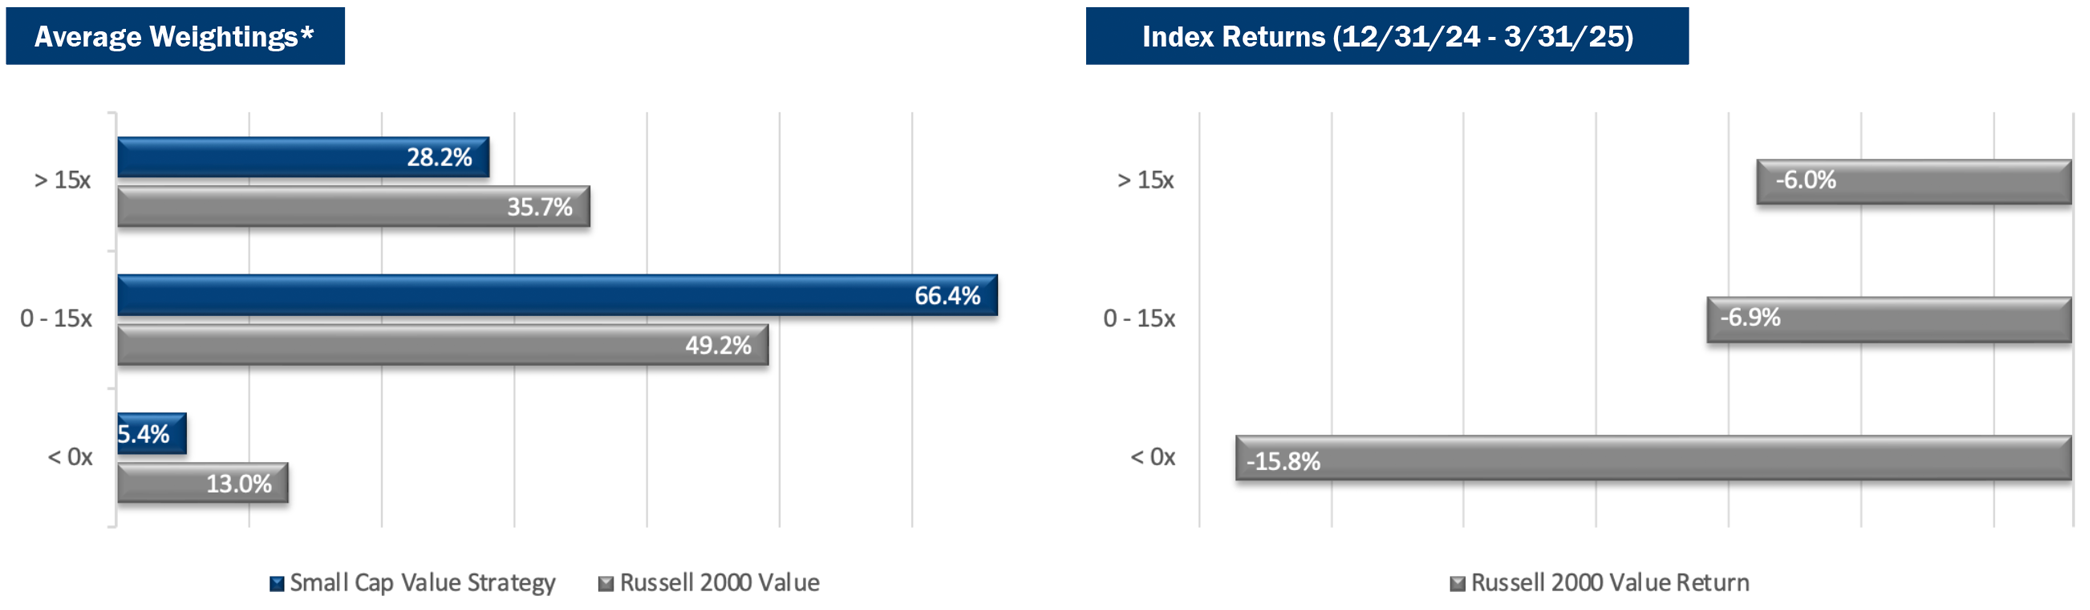
*P/E ratios are based on analyst estimates for the current fiscal year, including both completed and estimated quarterly results. Companies that have no earnings estimates have been excluded, and thus the bars may not add up to 100%.
Sector Analysis
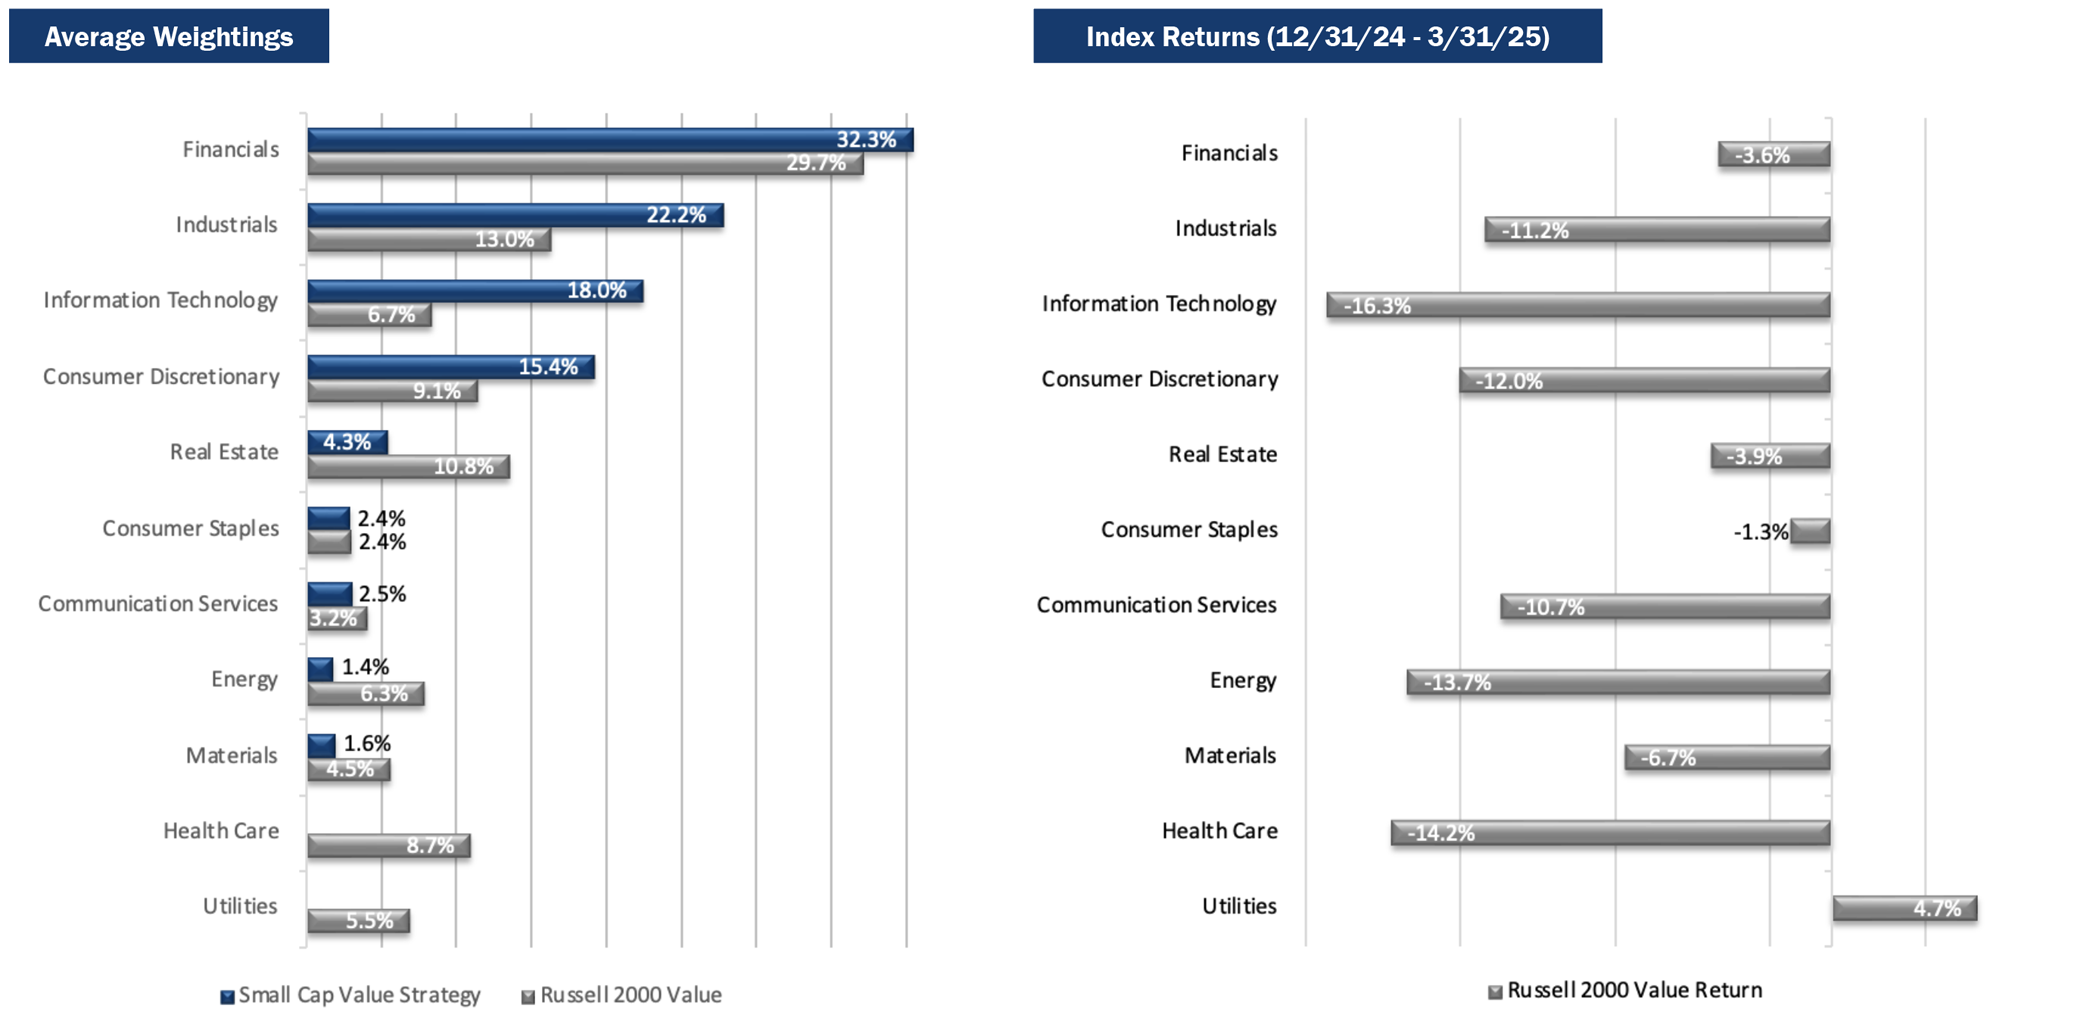
The top two contributing sectors to the Strategy’s performance were Financials and Health Care. A modest overweight in Financials, combined with positive stock selection scores, benefited the Strategy. The Strategy’s lack of Health Care investments provided a modest tailwind, compared to the Index that returned -14.2%. Conversely, the two sectors that most negatively impacted the Strategy’s performance were Consumer Discretionary and Information Technology. A significant overweight to Consumer Discretionary stocks, along with double-digit losses in the sector, led to a modest headwind. Additionally, the Strategy’s significant overweighting to the Information Technology sector, combined with it being the worst performer, modestly detracted from overall returns.
Portfolio Characteristics (as of 3/31/25)
Top Contributors
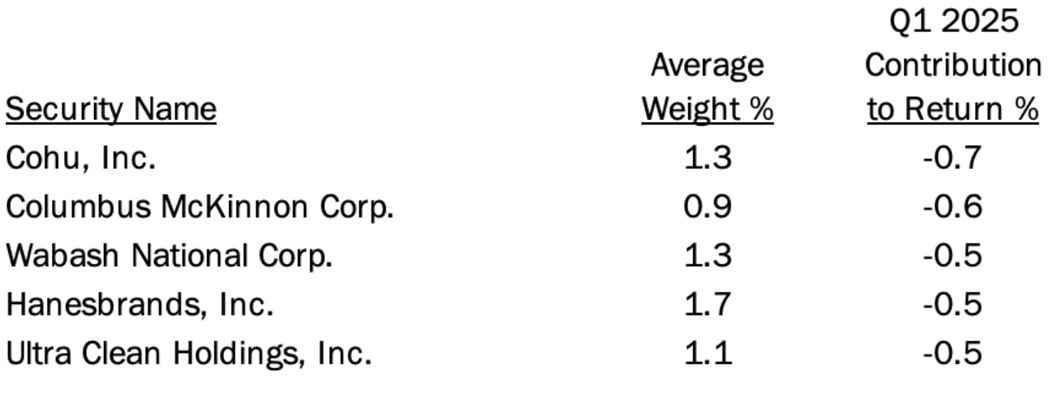
Top Detractors
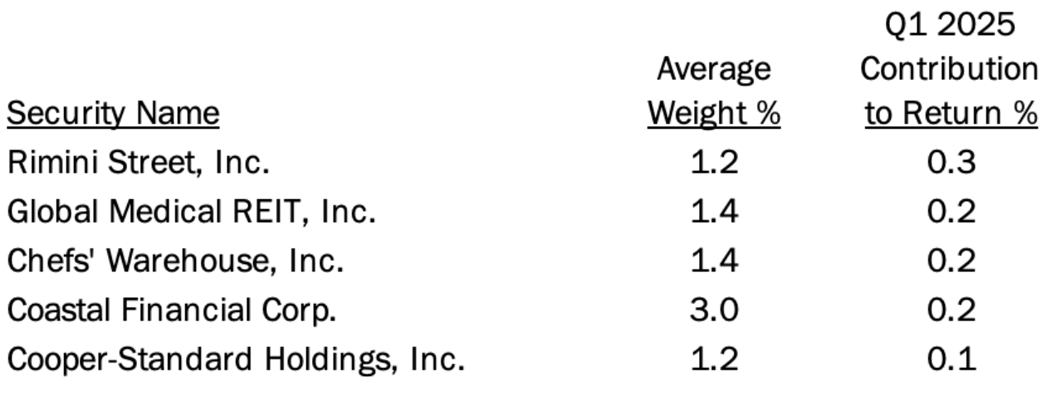
Top Contributors
Rimini Street (“RMNI”) is a provider of support and services for enterprise software. After many years of court battles over RMNI’s right to provide its services for Oracle’s PeopleSoft product, it appears as if the two sides might settle and end uncertainty and legal costs. Also, RMNI will begin to see significant benefits later this year from an important new relationship with ServiceNow. The stock has moved higher of late but remains attractively valued if both of these factors progress as anticipated.
Global Medical REIT (“GMRE”) is a real estate investment trust (REIT) that focuses on healthcare properties in secondary markets. The stock rebounded during the fourth quarter as interest rates declined. The underlying portfolio has been performing well, though real estate activity has been slow due to the rise in capitalization rates over the past several years. Given GMRE’s concentration within the healthcare space, we assume the company will be somewhat isolated from macroeconomic disruption on the global trade front.
Chefs’ Warehouse (“CHEF”), a distributor of high-quality specialty food products to the foodservice industry, reported better than expected results last quarter while surpassing the $1 billion revenue milestone for the first time. As a consolidator coming out of the pandemic, the company has delivered consistent margin expansion by using its operating leverage and pricing power. Free cash flow was strong last year, limiting financial risk, and its core customer base of casual and boutique specialty restaurant chains appears to be holding up well in the overall industry.
Coastal Financial (“CCB”) is a bank headquartered in Everett, WA. The company has two segments: a traditional community bank, and CCBX, a banking as a service (BaaS) provider that enables fintech companies to offer some banking services. Various regulatory bodies in recent years have increased their scrutiny on traditional banks, allowing BaaS providers like CCB to thrive. Demand for its services is so strong, the company raised capital during the fourth quarter to accelerate the number of potential new partners that it could serve. This move is expected to drive rapid earnings growth.
Cooper-Standard Holdings (“CPS”), a manufacturer of sealing, fuel, brake delivery, and fluid transfer systems for passenger vehicles, delivered further profit and margin improvement, despite slightly lower industry production volume. Following a massive restructuring during the pandemic, the company implemented a new organizational structure last year that has driven significant efficiencies and cost savings. Cash flow is expected to service the debt on the company’s balance sheet, and the valuation multiples remain depressed relative to profitability and industry outlook.
Top Detractors
Cohu, Inc. (“COHU”) makes a broad range of semiconductor equipment including test, inspection, handling, and contactor products. While the company has improved its positioning with a broader product portfolio, it is still relatively dependent on auto, industrial, and mobile handsets. As a result, COHU has remained in the trough portion of the cycle longer than some of its peers, resulting in a -45% move in the quarter, compared to -29% for the broader semiconductor group in the Index. Despite the prolonged depression of its share price, we believe that COHU will demonstrate more earnings power as the industry improves.
Columbus McKinnon (“CMCO”), a manufacturer of material handling equipment, issued guidance that fell short of expectations due to a slowing macro environment. The company also announced a major acquisition of a private lifting equipment competitor that will result in substantial leverage on its balance sheet. The market clearly disliked the timing of this purchase, given current uncertainties weighing on the global economy. We believe that the acquisition creates significant scale and geographic expansion that should result in major earnings growth, free cash flow, and a rapid reduction in CMCO’s debt burden.
Wabash National (“WNC”) is the leading manufacturer of semi-truck trailers, including a diversified line of truck bodies, tankers, and flat beds. We have been surprised by the magnitude of the share sell-off, down 35% in the quarter, given WNC’s solid profitability in a trough environment. The shares now trade for roughly a 10x PE on expected trough estimates for 2025, and barely over 2x on results as recent as 2023. Normalized earnings are somewhere in between and should conservatively support a much higher share price.
Hanesbrands (“HBI”) is a worldwide marketer of undergarments. The stock price declined when sales growth did not meet expectations, though margins showed improvement. With the sale of their Champion brand last year, the company was able to pay off a large portion of its debt. As debt service continues into 2025, free cash flow should improve.
Ultra Clean Holdings (“UCTT”) is a developer and manufacturer of critical subsystems in the semiconductor industry. The shares were down 40% in the quarter as the industry slump continues to last longer than most observers expected. However, 2025 should show improved results compared to 2024, despite management pointing to expected ongoing weakness in some of their China-based manufacturing. Despite a conservative balance sheet and anticipated profitability throughout the downcycle, the shares trade below a 10x PE on current year estimates and roughly 6x on more normalized estimates for 2026.
Market Review and Outlook
The first quarter of 2025 was a difficult period for financial markets. There was a sharp sell-off in technology stocks, particularly those tied to AI, following strong performance in that space during 2023 and 2024. Noise about potential tariffs worried investors heading into the end of the quarter. The Trump administration eventually announced tariffs at different levels on goods from various countries, and as high as 145% on China. This was partially reversed with a 90-day pause, though some of the tarrifs on China remain. The primary concern is that if tariffs remain in place long-term, they could fuel heightened uncertainty, slow growth, drive inflation, and potentially trigger a recession.
Economic data was mixed for the first quarter of the year as inflation remained slightly elevated, with the core PCE Index increasing to 2.8% in February. Despite the risk of higher inflation from tariffs, the market is currently pricing in four Fed cuts to the overnight rate in 2025 to help support economic growth. Also, the job market remains generally healthy for now, with the unemployment rate at 4.2% despite significant ongoing job cuts from the federal government. However there were signs that the economy is potentially slowing. The ISM Manufacturing Index fell to 49.0, and the Services PMI dropped to 50.8 in March, both at (or near) contraction levels. The Job Openings and Labor Turnover Survey (JOLTS) fell by 4.5% in February from the prior month, signaling the potential for reduced job growth in the coming quarter. The AAII Investor Sentiment and the VIX, both strong contrarian indicators, show extreme levels of bearishness and volatility.
The first quarter of 2025 was marked by significant market volatility, with pronounced concerns over trade policy. The market may continue to endure more pain in the coming quarters. However, the administration is closely watching the reaction to these policies and may elect to change course or announce compromise deals to stabilize capital markets. Small cap stocks sold off during the quarter and were largely left out of the rotation away from large cap growth stocks. If we see continued weakness from large cap tech while financials perform well, small- and micro-cap value may outperform, given their high concentration within the sector.
PRCP GIPS Report

*Information is not statistically meaningful due to an insufficient number of portfolios in the composite for the entire year.
Disclosures
Pacific Ridge Capital Partners, LLC (“Pacific Ridge”, “PRCP”, or “the Firm”) is a 100% employee-owned investment advisor registered with the Securities and Exchange Commission under the Investment Advisors Act of 1940. The Firm was established in June 2010, and has one office located in Lake Oswego, Oregon. Pacific Ridge claims compliance with the Global Investment Performance Standards (GIPS®) and has prepared and presented this report in compliance with the GIPS standards. Pacific Ridge has been independently verified for the periods June 10, 2010 through December 31 2024. A firm that claims compliance with the GIPS standards must establish policies and procedures for complying with all the applicable requirements of the GIPS standards. Verification provides assurance on whether the firm’s policies and procedures related to composite and pooled fund maintenance, as well as the calculation, presentation, and distribution of performance, have been designed in compliance with the GIPS standards and have been implemented on a firm-wide basis. The Small Cap Value composite has had a performance examination for the periods June 10, 2010 through December 31, 2024. The verification and performance examination reports are available upon request.
The Small Cap Value composite was created and incepted on August 1, 2010. The Small Cap Value composite comprises fully discretionary portfolios managed by the Firm invested primarily in an equity portfolio of small companies with market capitalizations similar to those found in the bottom three-quarters of the Russell 2000® Index. Smaller capitalization equities have historically had greater volatility than large capitalization equities. The Strategy ascribes to a disciplined bottom-up fundamental selection process with an emphasis given to the cash flow generating capabilities of a company. The Strategy’s objective is to outperform the Russell 2000 Value Index which is used as our benchmark. Eligible portfolios must be managed for a full calendar month prior to inclusion in the Small Cap Value composite. Composite dispersion is measured using an asset weighted standard deviation of gross returns of the portfolios included for the entire year. Returns and asset values are stated in US dollars.
The Russell 2000 Value Index measures the performance of the Russell 2000 companies with lower price-to-book ratios and lower forecasted growth values. For comparison purposes, the Index is fully invested, which includes the reinvestment of income. The return for the Index does not include any transaction costs, management fees or other costs. It is not possible to invest directly in the Index.
Sources: Pacific Ridge; FactSet Research Systems (“FactSet”); and Russell Investment Group (“Russell”) who is the source and owner of the Russell Index data.
Returns for the Small Cap Value composite are time-weighted and presented gross and net of management fees and other expenses and includes realized and unrealized gains and losses, cash and cash equivalents and related interest income, and accrued based dividends. Net returns are calculated by deducting the highest annual management fee of 1.00% from the quarterly gross composite return. Performance-based fees are available upon request. All returns are calculated after the deduction of the actual trading expenses incurred during the period.
The fee schedule for separately managed accounts is a flat rate of 1.00%.
The portfolio characteristics, sector weightings and attribution analysis for the Small Cap Value composite are based on a representative account within the Strategy. The representative account statistics are shown as supplemental information. The Firm maintains a complete list of contributors and detractors to portfolio return as well as a complete list and description of composites and pooled funds, policies for valuing portfolios, calculating performance, and preparing GIPS Reports, all of which are available upon request by contacting Peter Trumbo, Chief Operating Officer/Chief Compliance Officer at (503) 886-8972 or Peter.Trumbo@PacificRidgeCapital.com.
GIPS is a registered trademark of CFA Institute. CFA Institute does not endorse or promote this organization, nor does it warrant the accuracy or quality of the content contained herein.
Top and Bottom Performing Securities represent those security holdings that had the largest positive and negative total contribution to the portfolio return for the quarter. Top and Bottom Economic Sectors represent those sectors that had the largest positive and negative total contribution to the portfolio return. The holdings identified do not represent all the securities purchased, sold or recommended to clients.
In order to maintain consistency when comparing the Small Cap Value strategy to the Russell benchmark, the Firm utilizes FactSet’s outlier methodology calculations which provide a comparable portfolio characteristic calculation methodology as Russell applies to its indices.
The information provided should not be considered a recommendation to purchase or sell any particular security. There is no assurance that any securities discussed herein will remain in the Strategy at the time you receive this report or that securities sold have not been repurchased. It should not be assumed that any of the holdings discussed herein were or will be profitable or that the investment recommendations or decisions we make in the future will be profitable or will equal the investment performance of the securities discussed herein. Past performance is no guarantee of future results.
Although the statements of fact and data in this report have been obtained from, and are based upon, sources that the Firm believes to be reliable, we do not guarantee their accuracy, and any such information may be incomplete or condensed. All opinions included in this report constitute the Firm’s judgment as of the date of this report and are subject to change without notice. This report is for informational purposes only and is not intended as an offer or solicitation with respect to the purchase or sale of any security.
| Investment Team | Other Professionals | |||
| Dominic Marshall, CFA® | Senior Portfolio Manager | Peter Trumbo | Chief Operating Officer/Chief Compliance Officer | |
| Mark Cooper, CFA® | Portfolio Manager | Mike McDougall | Senior Trader | |
| Ryan Curdy, CFA® | Portfolio Manager | Manisha Thakkar, CFA® | Director of Business Development | |
| Justin McKillip, CFA® | Senior Analyst | Veronica Orazio | Operations Assistant | |
| Adam Wilkie, CFA® | Senior Analyst | |||
| Laura Moon | Analyst | |||
CFA® is a trademark owned by the CFA Institute. |
||||