

Performance Review
The Pacific Ridge Capital Partners Micro Cap Value strategy (the “Strategy”) returned -9.5%* (-9.9%* net of fees) during the first quarter ended March 31, 2025, outperforming the Russell Microcap® Value Index (the “Index”) return of -12.3%. For the trailing twelve-month period, the Strategy returned 1.6%* (0.0%* net of fees), outperforming the Index return of -7.6%.
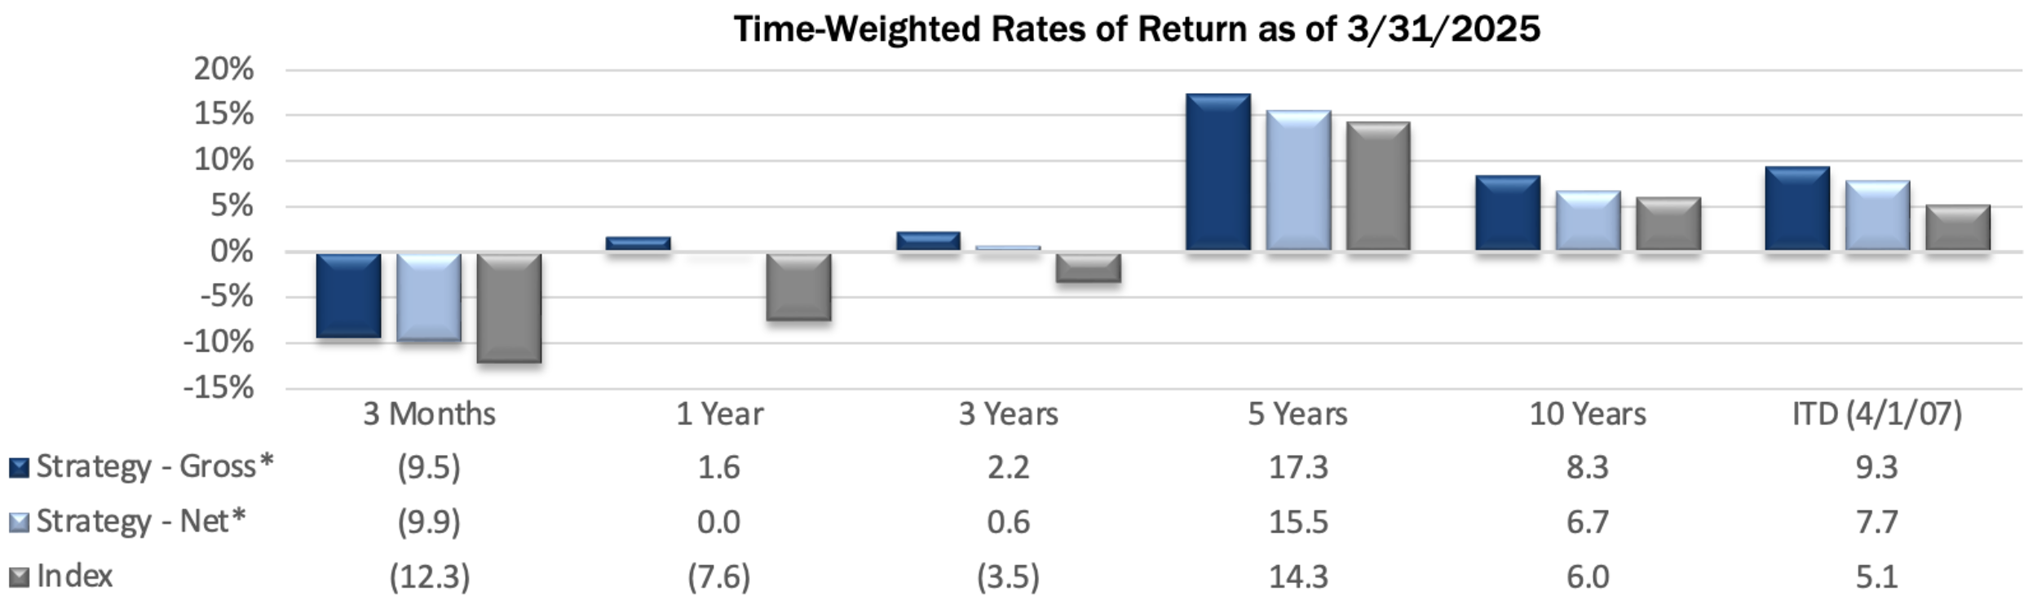
*For additional performance information, see the related GIPS® Report below.
The Strategy’s portfolio characteristics can be significantly different from the Index because we primarily invest in smaller, undervalued stocks and adopt a sector-agnostic approach. You can see these distinctions in the charts below.
Size Analysis
During the quarter, size bias had a minimal impact, as smaller companies within the Index underperformed larger ones by a narrow margin. Companies with market capitalizations below the Index median of $276 million showed a -12.6% return, while those above the median returned -12.2%. The Index had 15.9% of its weight to companies below the median, compared to the Strategy’s substantially higher allocation of 42.1%.

**The size breakpoint in the chart is based on the Index’s median market capitalization at the beginning of the period.
Style Analysis
The Strategy benefited from a significant value-style bias tailwind during the quarter. This was primarily due to its limited exposure to unprofitable companies (PE ratio below 0x), which were the worst-performing segment in the Index, returning -23.3%. While the Index held a 23.0% weighting in these stocks, the Strategy’s allocation was significantly lower at 6.9%. In contrast, profitable companies with lower valuations (PE ratio below 15x) posted the strongest returns at -7.1%, contributing positively to the Strategy’s performance. The Strategy was overweight in this segment at 55.9%, compared to the Index’s 42.5%.

*P/E ratios are based on analyst estimates for the current fiscal year, including both completed and estimated quarterly results. Companies that have no earnings estimates have been excluded, and thus the bars may not add up to 100%.
Sector Analysis
The top two contributing sectors to the Strategy’s performance were the Health Care and Information Technology sectors. The Strategy’s lack of Health Care investments provided a moderate tailwind as the sector declined -21.8% in the Index. Information Technology was the worst-performing sector in the Index with a return of -22.0%. The Strategy’s underweight position (8.9% versus 10.6%) in this sector resulted in a slight performance benefit. Conversely, the two sectors that most negatively impacted the Strategy’s performance were Industrials and Communication Services. The Industrials sector returned -16.5% in the Index, and the Strategy’s overweight (16.4% versus 13.4%) resulted in negative performance. In Communication Services, weights were similar between the Strategy and the Index, but the Strategy’s lone holding in the sector was down -21.5%, compared to the sector’s return in the Index of -8.4%.

Portfolio Characteristics (as of 3/31/25)

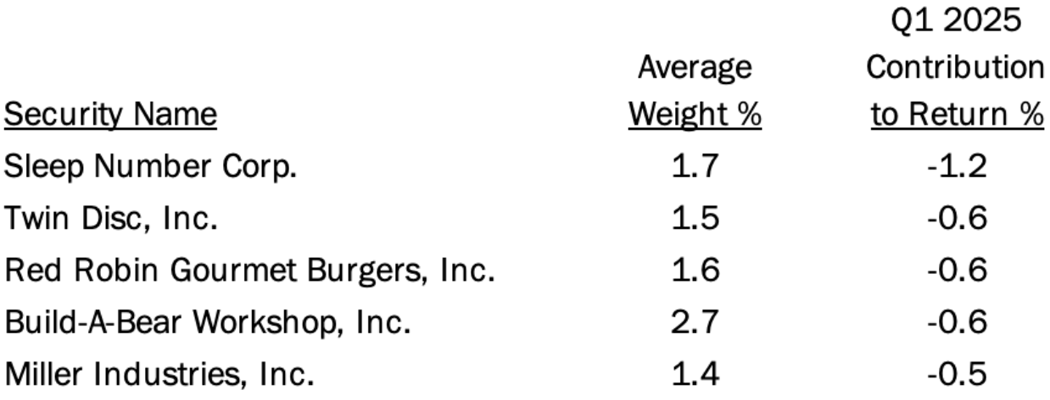
Top Contributors
Top Detractors

Top Contributors
Heritage Insurance Holdings (“HRTG”) is a property and casualty insurer based out of Tampa, FL. The company reported earnings that showed it was still profitable despite a massive hurricane early in the quarter. The insurance reforms implemented in the Florida market have significantly enhanced profitability for HRTG, and we expect core earnings should be well above current sell-side expectations.
Motorcar Parts of America (“MPAA”), a supplier of automotive aftermarket parts, reported better than expected earnings in its latest quarter and reaffirmed its full-year outlook. Following the implementation of cost savings initiatives over the past few years, volume increases have driven margins back to pre-pandemic levels. Management is confident that the company can sustain profitability and pass on looming tariff-related cost increases. The shares remain attractively priced, and the market should reward higher multiples as the company continues to successfully execute its turnaround.
Alico (“ALCO”) has historically farmed citrus in Florida, most notably growing oranges for use in juice. In early January, ALCO announced a change in strategic focus to exit its problematic citrus business. Instead, the company plans to maximize the value of its roughly 50,000 acres of land owned in Florida via land leasing and development activities. This move aligns better with our investment thesis for the stock, which was up 15%. We expect more value to be unlocked as ALCO announces additional details on its land development and sale agreements in the coming years.
Rimini Street (“RMNI”) is a provider of support and services for enterprise software. After many years of court battles over RMNI’s right to provide its services for Oracle’s PeopleSoft product, it appears as if the two sides might settle and end uncertainty and legal costs. Also, RMNI will begin to see significant benefits later this year from an important new relationship with ServiceNow. The stock has moved higher of late but remains attractively valued if both of these factors progress as anticipated.
Hamilton Beach Brands (“HBB”) is a marketer of residential and commercial kitchen appliances. HBB was among the top detractors in the previous quarter after posting weaker than anticipated results. In the most recent quarter, results exceeded estimates, and the shares rebounded. The stock is attractively valued relative to HBB’s demonstrated strong free cash flow, which is masked to some degree by losses incurred in its home healthcare endeavor.
Top Detractors
Sleep Number (“SNBR”) is a designer, manufacturer, and marketer of mattresses and bedding accessories. Fourth quarter earnings were weak, though this was not unexpected given industry struggles over the past year. Management is working to reduce expenses and navigate toward a better financial environment for the company. With a return to normalized levels of mattress sales in the coming years, earnings should rebound, followed by an improvement in the stock price.
Twin Disc (“TWIN”), a manufacturer of power transmission equipment, reported solid results in its latest quarter. TWIN turned in double-digit organic revenue growth driven by strong demand for its marine and propulsion products, plus continued momentum for its land-based transmission equipment in the airport rescue and firefighting markets. The company also announced an accretive acquisition that adds complementary products in the industrial and marine end markets. However, shares have sold off on macro concerns, and at less than 4x cash flow, TWIN is trading at historically low multiples not seen since 2009.
Red Robin Gourmet Burgers (“RRGB”), a family-friendly restaurant chain, continues to have a roller coaster stock price chart. Despite recently posting stronger than expected results that briefly sent the stock higher, the shares were down 35% in the quarter. The market is concerned about consumer weakness, labor costs and their impact on the casual dining segment. RRGB also carries some expensive debt and high corporate expense levels compared to larger multi-brand restaurant groups. RRGB remains a strong brand, and management appears to be executing a turnaround. We believe better times are ahead.
BuildABear Workshop (“BBW”) is a specialty retailer that offers an interactive “make your own stuffed animals” experience. After moving higher in the previous two quarters, the shares traded off 19%, despite continuing to report strong results. Insider selling and tariff-related concerns were likely culprits. Management continues to focus on store unit expansion, most notably in partner and franchise operated locations that have strong economics and minimal capital requirements. We expect these initiatives will continue to impact BBW’s top- and bottom-line positively.
Miller Industries (“MLR”), a manufacturer of tow trucks and recovery equipment, reported earnings during the quarter that were well short of expectations. The company saw a sharp drop in chassis shipments on a year-over-year basis, as customers had previously been restocking following the supply chain disruptions. Despite the weak guidance, MLR should remain decently profitable. With less working capital investment, free cash flow should pick up.
Market Review and Outlook
The first quarter of 2025 was a difficult period for financial markets. There was a sharp sell-off in technology stocks, particularly those tied to AI, following strong performance in that space during 2023 and 2024. Noise about potential tariffs worried investors heading into the end of the quarter. The Trump administration eventually announced tariffs at different levels on goods from various countries, and as high as 145% on China. This was partially reversed with a 90-day pause, though some of the tarrifs on China remain. The primary concern is that if tariffs remain in place long-term, they could fuel heightened uncertainty, slow growth, drive inflation, and potentially trigger a recession.
Economic data was mixed for the first quarter of the year as inflation remained slightly elevated, with the core PCE Index increasing to 2.8% in February. Despite the risk of higher inflation from tariffs, the market is currently pricing in four Fed cuts to the overnight rate in 2025 to help support economic growth. Also, the job market remains generally healthy for now, with the unemployment rate at 4.2% despite significant ongoing job cuts from the federal government. However there were signs that the economy is potentially slowing. The ISM Manufacturing Index fell to 49.0, and the Services PMI dropped to 50.8 in March, both at (or near) contraction levels. The Job Openings and Labor Turnover Survey (JOLTS) fell by 4.5% in February from the prior month, signaling the potential for reduced job growth in the coming quarter. The AAII Investor Sentiment and the VIX, both strong contrarian indicators, show extreme levels of bearishness and volatility.
The first quarter of 2025 was marked by significant market volatility, with pronounced concerns over trade policy. The market may continue to endure more pain in the coming quarters. However, the administration is closely watching the reaction to these policies and may elect to change course or announce compromise deals to stabilize capital markets. Small cap stocks sold off during the quarter and were largely left out of the rotation away from large cap growth stocks. If we see continued weakness from large cap tech while financials perform well, small- and micro-cap value may outperform, given their high concentration within the sector.
PRCP GIPS Report

*2021 Composite Dispersion excluding one account with a significant cash flow was 0.2%.
Disclosures
Pacific Ridge Capital Partners, LLC (“Pacific Ridge”, “PRCP”, or “the Firm”) is a 100% employee-owned investment advisor registered with the Securities and Exchange Commission under the Investment Advisors Act of 1940. The Firm was established in June 2010, and has one office located in Lake Oswego, Oregon. Pacific Ridge claims compliance with the Global Investment Performance Standards (GIPS®) and has prepared and presented this report in compliance with the GIPS standards. Pacific Ridge has been independently verified for the periods June 10, 2010 through December 31, 2024. A firm that claims compliance with the GIPS standards must establish policies and procedures for complying with all the applicable requirements of the GIPS standards. Verification provides assurance on whether the firm’s policies and procedures related to composite and pooled fund maintenance, as well as the calculation, presentation, and distribution of performance, have been designed in compliance with the GIPS standards and have been implemented on a firm-wide basis. The Micro Cap Value composite has had a performance examination for the periods June 10, 2010 through December 31, 2024. The verification and performance examination reports are available upon request.
The Micro Cap Value composite was created on June 10, 2010 and incepted on April 1, 2007. Performance from 2007 to 2010 is from portfolios managed at another entity. The Micro Cap Value composite comprises fully discretionary portfolios managed by the Firm invested primarily in a concentrated equity portfolio of smaller companies with market capitalizations similar to those found in the Russell Microcap® Index. Smaller capitalization equities have historically had greater volatility than large capitalization equities. The Strategy ascribes to a disciplined bottom-up fundamental selection process with an emphasis given to the cash flow generating capabilities of a company. The Strategy’s objective is to outperform the Russell Microcap Value Index which is used as our benchmark. Eligible portfolios must be managed for a full calendar month prior to inclusion in the Micro Cap Value composite. Composite dispersion is measured using an asset weighted standard deviation of gross returns of the portfolios included for the entire year. Returns and asset values are stated in US dollars.
The Russell Microcap Value Index measures the performance of the microcap segment of the U.S. equity market. For comparison purposes, the Index is fully invested, which includes the reinvestment of income. The return for the Index does not include any transaction costs, management fees or other costs. It is not possible to invest directly in the Index.
Sources: Pacific Ridge; FactSet Research Systems (“FactSet”); and Russell Investment Group (“Russell”) who is the source and owner of the Russell Index data.
Returns for the Micro Cap Value composite are time-weighted and presented gross and net of management fees and other expenses and includes realized and unrealized gains and losses, cash and cash equivalents and related interest income, and accrued based dividends. Net returns are calculated by deducting the highest annual management fee of 1.50% from the quarterly gross composite return. Performance-based fees are available upon request. All returns are calculated after the deduction of the actual transaction costs incurred during the period.
The fee schedule for separately managed accounts is a flat rate of 1.50%.
The portfolio characteristics, sector weightings and attribution analysis for the Micro Cap Value composite are based on a representative account within the Strategy. The representative account statistics are shown as supplemental information. The Firm maintains a complete list of contributors and detractors to portfolio return as well as a complete list and description of composites and pooled funds, policies for valuing portfolios, calculating performance, and preparing GIPS Reports, all of which are available upon request by contacting Peter Trumbo, Chief Operating Officer/Chief Compliance Officer at (503) 886-8972 or Peter.Trumbo@PacificRidgeCapital.com.
GIPS is a registered trademark of CFA Institute. CFA Institute does not endorse or promote this organization, nor does it warrant the accuracy or quality of the content contained herein.
Top and Bottom Performing Securities represent those security holdings that had the largest positive and negative total contribution to the portfolio return for the quarter. Top and Bottom Economic Sectors represent those sectors that had the largest positive and negative total contribution to the portfolio return. The holdings identified do not represent all the securities purchased, sold or recommended to clients.
In order to maintain consistency when comparing the Micro Cap Value strategy to the Russell benchmark, the Firm utilizes FactSet’s outlier methodology calculations which provide a comparable portfolio characteristic calculation methodology as Russell applies to its indices.
The information provided should not be considered a recommendation to purchase or sell any particular security. There is no assurance that any securities discussed herein will remain in the Strategy at the time you receive this report or that securities sold have not been repurchased. It should not be assumed that any of the holdings discussed herein were or will be profitable or that the investment recommendations or decisions we make in the future will be profitable or will equal the investment performance of the securities discussed herein. Past performance is no guarantee of future results.
Although the statements of fact and data in this report have been obtained from, and are based upon, sources that the Firm believes to be reliable, we do not guarantee their accuracy, and any such information may be incomplete or condensed. All opinions included in this report constitute the Firm’s judgment as of the date of this report and are subject to change without notice. This report is for informational purposes only and is not intended as an offer or solicitation with respect to the purchase or sale of any security.
| Investment Team | Other Professionals | |||
| Dominic Marshall, CFA® | Senior Portfolio Manager | Peter Trumbo | Chief Operating Officer/Chief Compliance Officer | |
| Mark Cooper, CFA® | Portfolio Manager | Mike McDougall | Senior Trader | |
| Ryan Curdy, CFA® | Portfolio Manager | Manisha Thakkar, CFA® | Director of Business Development | |
| Justin McKillip, CFA® | Senior Analyst | Veronica Orazio | Operations Assistant | |
| Adam Wilkie, CFA® | Senior Analyst | |||
| Laura Moon | Analyst | |||
CFA® is a trademark owned by the CFA Institute. |
||||