

Q1'17 Small Cap Value Strategy
The Pacific Ridge Capital Partners (“PRCP”) Small Cap Value strategy rose 3.3%* in the first quarter of 2017, ahead of the -0.1% return for the Russell 2000® Value Index (“Index”). Over the trailing one-, three-, and five-year periods, the strategy returned 34.5%*, 9.2%*, and 15.4%* (annualized), respectively, compared to the Index returns of 29.4%, 7.6%, and 12.5%. Since inception on August 1, 2010, the strategy has returned 15.1%* annually versus 12.9% for the Index.
The strong move in equity markets following the recent election has been attributed to several potential catalysts: lower taxes, fewer regulations, potential health care reform, and a stronger economy. The markets took a bit of a breather during the first quarter as investors struggled to reconcile ambitious campaign promises with the realities of governing, even with one party in control of both the White House and Congress. Recent meetings and discussions with various management teams have left us feeling optimistic about the direction of the economy. However, we recently came across research highlighting the growing gap between “soft” survey-based economic data compared to other indicators that are based on “hard” data such as industrial production and retail sales. This divergence has led to markedly different GDP growth forecasts, with the NY Fed estimating a solid 3% growth rate, while the Atlanta Fed is tracking closer to 1%. Whether it is divergent economic data, competing legislative priorities, or even whether the best picture winner was Moonlight or La La Land, the world appears to be awash in mixed signals.

As value focused investors with a bottom-up stock-picking approach, we are not dependent upon any specific macroeconomic outcome to outperform our benchmarks. Regardless of the pace of economic growth, whether it be a new economic boom, continued slow and steady growth, or a recession, we will continue to adhere to our proven value-oriented investment philosophy.
First Quarter 2017
For the quarter, the Small Cap Value strategy delivered 340 basis points of excess return versus the Russell 2000 Value Index. The strategy faced a moderate headwind due to size bias, given that larger market cap segments outperformed smaller ones and we primarily invest in companies whose market caps fall in the bottom 75th percentile of the Russell 2000® Index. In the Russell 2000 Value, stocks with a market cap below $500 million fell 0.5%, while those with a market cap greater than $1.5 billion returned 0.9%. For both the strategy and the Index, stocks with higher betas performed significantly better than low beta stocks.
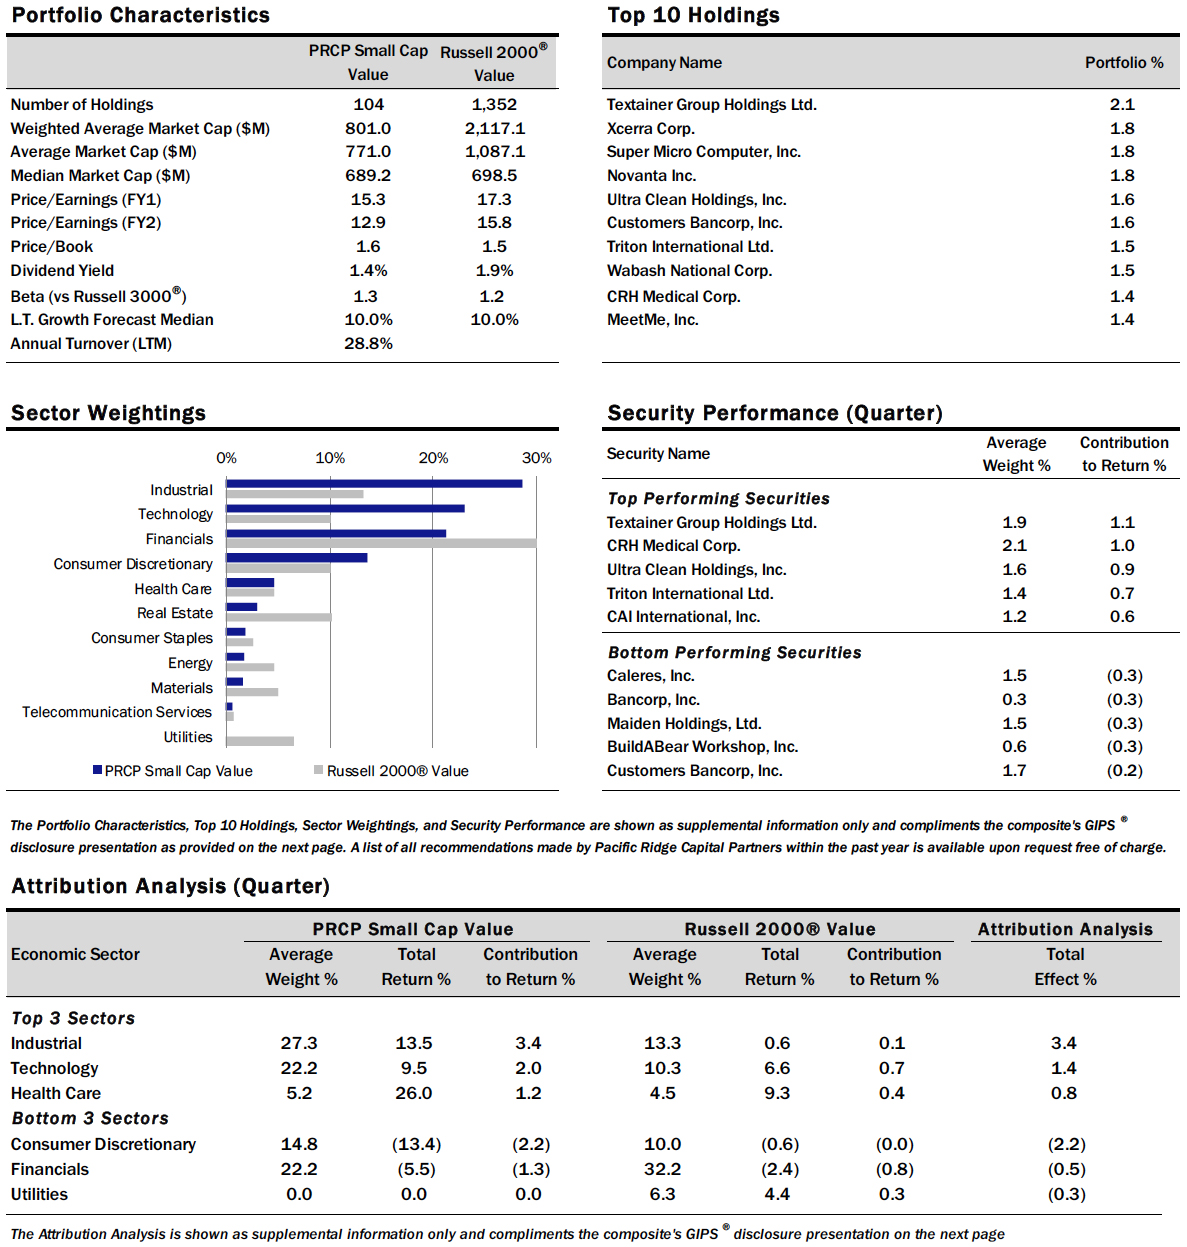
From a sector standpoint, the strategy’s performance in the Industrials and Information Technology sectors contributed nearly 480 basis points of excess return versus the Index. However, poor performance in Consumer Discretionary detracted around 220 basis points versus the Index. The lack of Utilities exposure within the strategy created a modest headwind, as it outperformed the Index and detracted about 30 basis points of return.

Industrials remained the highest weighted sector in the strategy at 27.4% and is the greatest overweight compared to the Index at 13.3%. The strategy’s holdings in the sector returned 13.5% in the period, compared to a 0.6% gain in the Index. The greatest contributor to performance in the sector was Textainer Group (“TGH”), with its shares returning 105.4% in the quarter. TGH, the world’s second largest shipping container lessor, rebounded in the first quarter following a difficult 2016, when its stock hit multi-year lows. Pricing in the industry began to firm following a long downward trend and excess capacity. Additionally, a rebound in general commodity prices and a slight uptick in trade activity contributed to strong performance. Despite the recent strength, we continue to find valuations in the container lessor space attractive.
Barrett Business Services (“BBSI”), a leading human resource management and staff leasing provider, was the greatest detractor to returns in the Industrials sector, with its shares down 14.5% in the quarter. BBSI sold off following disappointing earnings results, combined with 2017 guidance that was a bit lower than expected. This correction occurred after a strong run in the stock over the prior year, driven by the resolution of outstanding accounting and regulatory issues.
Financials was the second highest weighted sector in the strategy at 22.3%, and had the greatest underweight compared to the Index at 32.2%. The strategy’s holdings in this sector fell 5.5% during the period, compared to a decline of 2.4% in the Index. Banc of California (“BANC”), a community bank headquartered in Southern California, was the greatest contributor to returns in the sector, with shares up 40.8%. BANC was a former holding in the strategy that we sold last year after it achieved our price target. It subsequently came under attack from short-sellers who alleged the bank was secretly controlled by a convicted felon. Following these allegations, the stock sold off aggressively, leading us to re-establish a position. Strong earnings, the departure of the former CEO, and the completion of an independent investigation contributed to a strong rebound in the stock price.
Bancorp (“TBBK”) was the greatest detractor to returns in the Financials sector, with its shares down 36.4% during the period. TBBK, a community bank headquartered in Delaware, is in the process of a slow earnings turnaround, but continues to battle credit issues with their legacy commercial loan book. We recently purchased the stock believing new management had a handle on their problem credits, but now that appears questionable after another sizable provision in the first quarter.
Information Technology was the third highest weighted sector at 22.2%, compared to 10.3% in the Index. The strategy’s holdings in this sector returned 9.5% during the period, compared to a 6.6% gain in the Index. Ultra Clean Holdings (“UCTT”) was the greatest contributor to returns in the sector, with the shares returning 73.9% in the quarter. UCTT, a developer and manufacturer of critical subsystems in the semiconductor capital equipment industry, has posted several quarters of strong results based on increased demand from their two largest customers. They are also on track to meet their 2017 guidance. Operating margins have rebounded from recent lows and appear to be headed towards the high single-digits.
Super Micro Computer (“SMCI”) was the greatest detractor to returns in the Information Technology sector, with the shares down 9.6% in the quarter. SMCI, a maker of specialized application-specific server solutions, gave back some of the gains its stock made in late 2016. While the company announced earnings during the quarter that beat estimates, gross margins came in a bit lower than expected. This was due to limited supply and higher prices for flash memory. Management claims this issue is temporary and should be resolved by the second half of the year. The stock came under further pressure following claims on a blog post about an alleged security issue raised by one of SMCI’s customers. While these claims were quickly refuted by the company, there was still a small impact to the stock price.
As always, we continue to search for companies that demonstrate an ability to earn a fair return on capital. We welcome any questions or comments you may have, and thank you for your continued support.
Sincerely,
Pacific Ridge Capital Partners
*Returns are preliminary
Note: Sector weights for the strategy and Index are the average for the period

Disclosures
Pacific Ridge Capital Partners, LLC (“Pacific Ridge”, “PRCP”, or “the Firm”) is a 100% employee owned investment advisor registered with the Securities and Exchange Commission under the Investment Advisors Act of 1940. The Firm was established in June 2010, and has one office located in Lake Oswego, Oregon. Pacific Ridge claims compliance with the Global Investment Performance Standards (GIPS®) and has prepared and presented this report in compliance with the GIPS standards. PRCP has been independently verified for the periods June 10, 2010 through December 31, 2016. Verification assesses whether (1) the Firm has complied with all the composite construction requirements of the GIPS standards on a firm-wide basis and (2) the Firm’s policies and procedures are designed to calculate and present performance in compliance with the GIPS standards. The Small Cap Value composite has been examined for the periods August 1, 2010 through December 31, 2016. The verification and performance examination reports are available upon request.
The Small Cap Value composite was created on August 1, 2010. The Small Cap Value composite comprises fully discretionary portfolios managed by the Firm invested primarily in an equity portfolio of small companies with market capitalizations similar to those found in the bottom three-quarters of the Russell 2000® Index. The strategy ascribes to a disciplined bottom-up fundamental selection process with an emphasis given to the cash flow generating capabilities of a company. The strategy’s objective is to outperform the Russell 2000® Value Index which is used as our benchmark. Eligible portfolios must be managed for a full calendar month prior to inclusion in the Small Cap Value composite. Composite dispersion is measured using an asset weighted standard deviation of returns of the portfolios. Returns and asset values are stated in US dollars.
The Russell 2000® Value Index measures the performance of the Russell 2000 companies with lower price-to-book ratios and lower forecasted growth values. For comparison purposes, the index is fully invested, which includes the reinvestment of income. The return for the index does not include any transaction costs, management fees or other costs.
Sources: Pacific Ridge; FactSet Research Systems (“FactSet”); and Russell Investment Group (“Russell”) who is the source and owner of the Russell Index data.
Returns for the Small Cap Value composite are presented gross and net of management fees and other expenses and includes realized and unrealized gains and losses, cash and cash equivalents and related interest income, and accrued based dividends. Net returns are calculated by deducting the highest annual management fee of 1.00% from the quarterly gross composite return. All returns are calculated after the deduction of the actual trading expenses incurred during the period.
The management fee is a flat rate of 1.00%.
The portfolio characteristics, sector weightings and attribution analysis for the Small Cap Value composite are based on a representative account within the strategy. The representative account statistics are shown as supplemental information. The Firm maintains a complete list and description of composites, policies for valuing portfolios, calculating performance, and preparing compliant presentations which are available upon request by contacting Peter Trumbo, Chief Compliance Officer at (503) 886-8972 or Peter.Trumbo@PacificRidgeCapital.com.
Top 5 and Bottom 5 Performing Securities represent those security holdings that had the largest positive and negative total contribution to the portfolio return. Top 3 and Bottom 3 Economic Sectors represent those sectors that had the largest positive and negative total contribution to the portfolio return.
In order to maintain consistency when comparing the Small Cap Value strategy to the Russell benchmark, the Firm utilizes FactSet’s outlier methodology calculations which provide a comparable portfolio characteristic calculation methodology as Russell applies to its indices.
The information provided should not be considered a recommendation to purchase or sell any particular security. There is no assurance that any securities discussed herein will remain in our strategy at the time you receive this report or that securities sold have not been repurchased. It should not be assumed that any of the holdings discussed herein were or will be profitable or that the investment recommendations or decisions we make in the future will be profitable or will equal the investment performance of the securities discussed herein. Past performance is no guarantee of future results.
Although the statements of fact and data in this report have been obtained from, and are based upon, sources that the Firm believes to be reliable, we do not guarantee their accuracy, and any such information may be incomplete or condensed. All opinions included in this report constitute the Firm’s judgment as of the date of this report and are subject to change without notice. This report is for informational purposes only and is not intended as an offer or solicitation with respect to the purchase or sale of any security.