

Q4'16 Small Cap Value Strategy
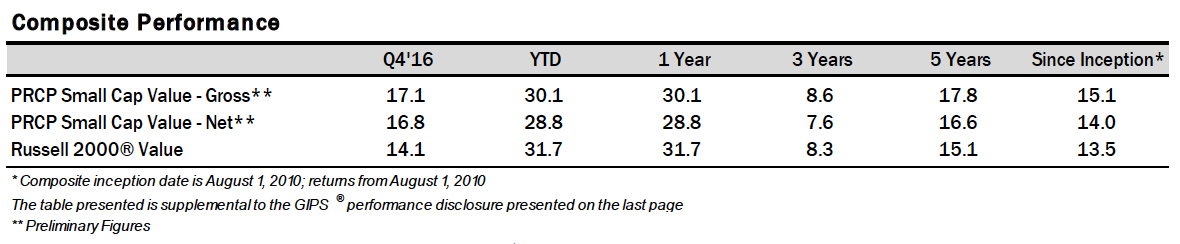
The Pacific Ridge Capital Partners (“PRCP”) Small Cap Value strategy rose 17.1%* in the fourth quarter of 2016, ahead of the 14.1% return for the Russell 2000® Value Index (“Index”). Over the trailing one-, three-, and five-year periods, the strategy returned 30.1%*, 8.6%*, and 17.8%* (annualized), respectively, compared to the Index returns of 31.7%, 8.3%, and 15.1%. Since inception on August 1, 2010, the strategy has returned 15.1%* annually versus 13.5% for the Index.
With the surprise outcomes of the Brexit vote, the US presidential election and the Cubs finally winning the World Series in 2016, we learned to expect the unexpected. Attempting to manage a strategy based in part on geopolitical outcomes would have proved difficult last year. Because a core part of our strategy is that we are not catalyst dependent (particularly in the short-term) and we tend to be contrarians by nature, we frequently question conventional wisdom and prefer to focus on valuation. This quarter, we saw clear benefits to this approach. While small-cap companies were largely out of favor early in the year, they came roaring back in the second half of the year. While higher-yielding stocks performed well the past few years, they were notable laggards over the second half of 2016. Such swings in sentiment are not uncommon and more sophisticated investors should be able to resist the urge to chase the latest fad. Despite what unexpected events may transpire in the future, we will continue to adhere to our proven value-oriented investment philosophy.
Fourth Quarter 2016
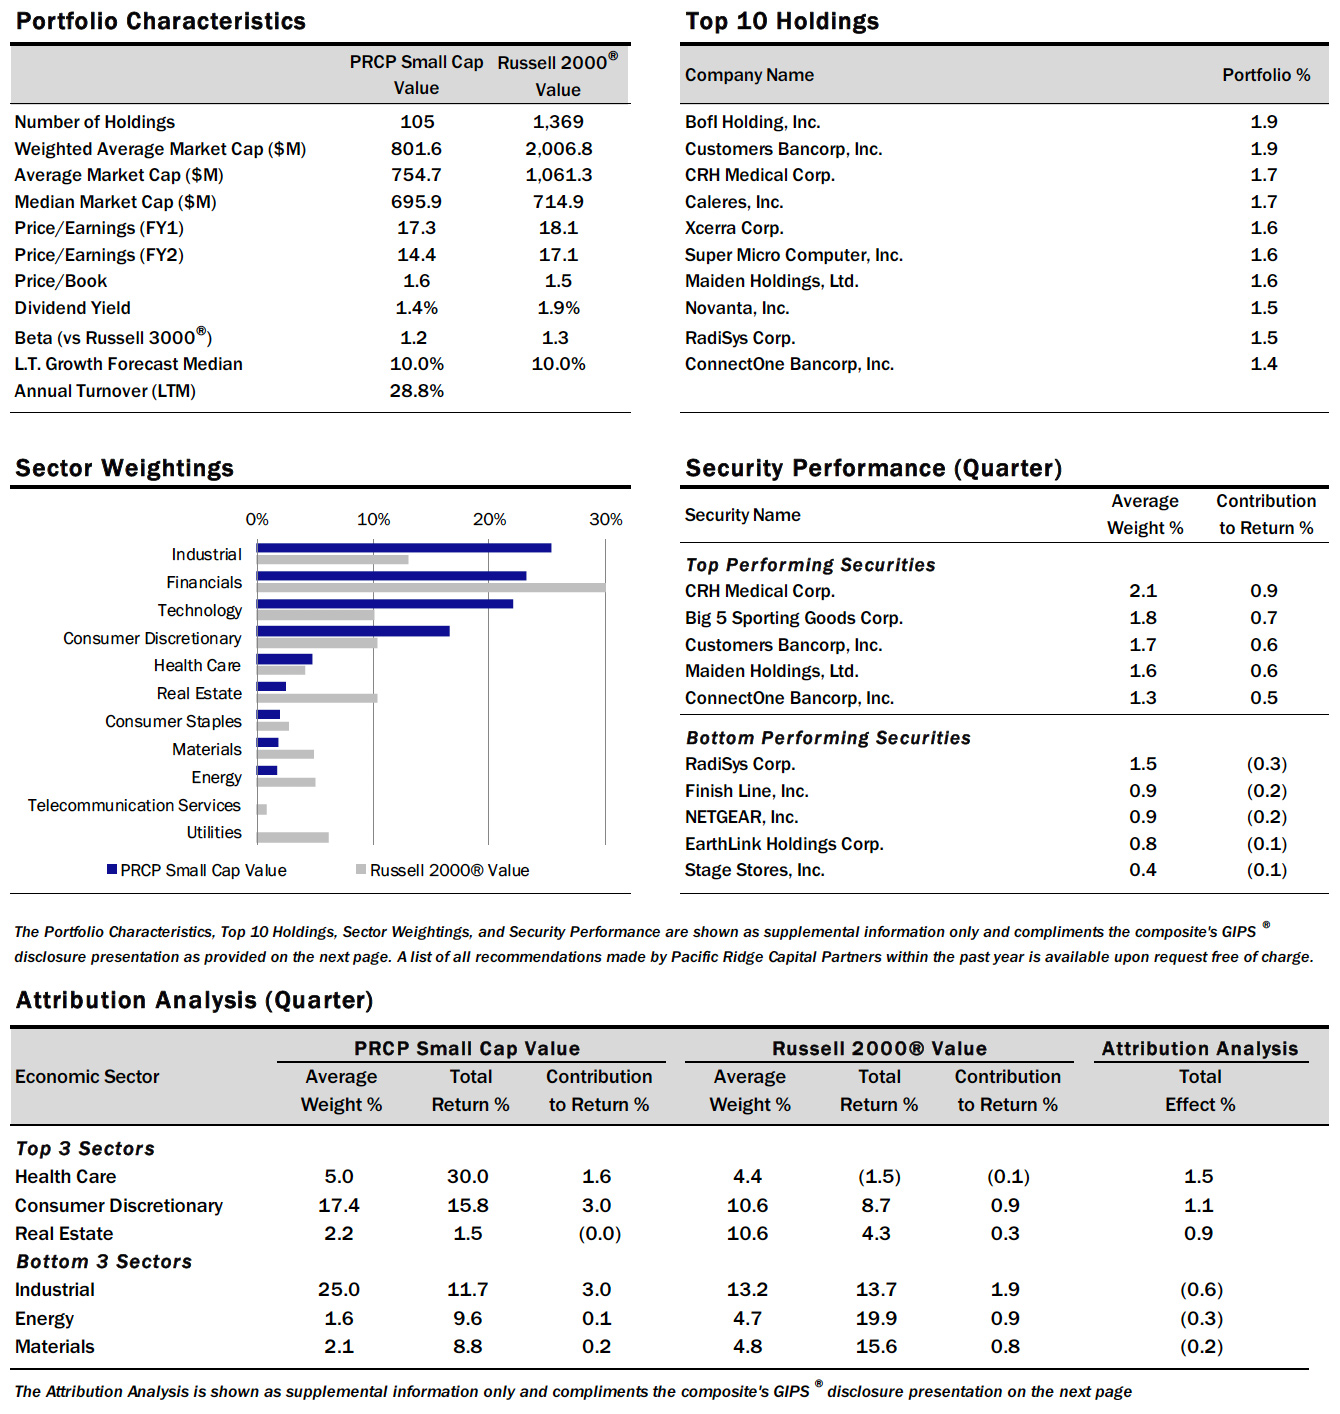
The Small Cap Value strategy delivered 300 basis points of excess return versus the Russell 2000 Value Index for the quarter. We benefited from another quarter of size bias, given that smaller market cap segments outperformed larger ones and we primarily invest in companies whose market caps fall in the bottom 75th percentile of the Russell 2000 Index. In the Russell 2000 Value, stocks with a market cap below $500 million returned 16.3%, while those with a market cap greater than $1.5 billion returned 12.6%.
Within our strategy, stocks with lower P/E’s performed significantly better than those with higher P/E’s. The strategy also benefited from being overweight in lower P/E stocks relative to the Index.
From a sector standpoint, the strategy’s stock selection in Health Care contributed over 150 basis points of return versus the Index. However, poor stock selection in Energy and Industrials detracted about 90 basis points versus the Index. The lack of Utilities exposure within the strategy was again a tailwind, as it was one of the worst performing sectors in the Index (5.3%) and resulted in 64 basis points of excess return during the quarter.
Industrials remained the highest weighted sector in the strategy at 25.0%, and is the second greatest overweight compared to the index at 13.2%. The strategy’s holdings in the sector returned 11.7% in the period, compared to a 13.7% gain in the Index. The greatest contributor to performance in the sector was Barrett Business Services (“BBSI”), with its shares returning 29.7% in the quarter. BBSI, a leading human resource management and staff leasing provider, caught up with their SEC filings earlier this year as it worked through a series of accounting issues. Though recent results were reduced somewhat from increased audit and legal costs, it appears that higher revenues, along with operating leverage, will continue to drive earnings growth.
Standex International (“SXI”), a manufacturer of food service equipment and other industrial products, was the greatest detractor to returns in the Industrials sector, with its shares down 5.2% in the quarter. Shares were down nearly 20% in October after SXI reported an earnings shortfall. Since then, the stock has gained most of it back following the post-election market rally. The slowdown from restaurant, dollar, and drug store customers continues to weigh on sales of refrigerated and cooking equipment but further restructuring should help protect margins. Given that the company’s other businesses are performing very well, and recent announcements from several large restaurant chains indicate an increase in capital purchases, we expect SXI to benefit from the favorable spending outlook for food service equipment.
Financials was the second highest weighted sector in the strategy at 22.4%, and had the greatest underweight compared to the Index at 31.2%. The strategy’s holdings in this sector increased 29.1% during the period, compared to a 24.2% gain in the Index. Customers Bancorp (“CUBI”), a Pennsylvania based community bank, was the greatest contributor to returns in the sector, with shares up 42.4%. Along with the rest of the banking sector, CUBI benefited from the surprise outcome of the election as expectations of a reduced regulatory footprint drove shares higher. Additionally, higher interest rates fueled renewed hope for long-awaited margin expansion, a key driver for continued earnings growth. Despite the move in the stock, the fundamentals and valuation continue to appear relatively attractive.
Third Point Reinsurance (“TPRE”) was the greatest detractor to returns in the Financials sector, with its shares down 3.8% during the period. TPRE, a Bermuda-based reinsurance company, is affiliated with the hedge fund Third Point, managed by Daniel Loeb. The company looks to break even on their underwriting while still generating strong ROEs by leveraging returns of the Third Point fund. Returns in that fund over the past year have been inconsistent, resulting in slower book value growth for TPRE. Given their excellent long-term track record and the attractive valuation, we have recently added to our position.
Information Technology was the third highest weighted sector at 22.3%, compared to 10.1% in the Index. The strategy’s holdings in this sector returned 14.8% during the period, compared to a 13.2% gain in the Index. Ultra Clean Holdings (“UCTT”) was the greatest contributor to returns in the sector, with the shares returning 30.9% in the quarter. UCTT, a developer and manufacturer of critical subsystems in the semiconductor capital equipment industry, posted strong quarterly results and implied strong guidance for 2017 based on increased demand from their two largest customers. Operating margins have rebounded from recent lows and appear to be headed towards the high single-digits. UCTT remains one of our largest positions in the strategy.
RadiSys Corporation (“RSYS”) was the greatest detractor to returns in the Information Technology sector, with the shares down 17.1% in the quarter. RSYS, a developer of hardware and software for the telecommunications industry, reported disappointing earnings, sending its shares down 10% on the announcement. Also contributing to the weakness were comments that indicated increased expenditures going forward for sales personnel and network engineers. After speaking with management, however, we believe the increased expense is warranted, given potential orders from new large customers in 2017. We added to our position following the recent weakness and feel the stock will perform well should these new customers materialize.
2016 Full Year
The Small Cap Value strategy underperformed the Russell 2000 Value Index for the year by approximately 160 basis points. The strategy benefited slightly from size bias during the year, with the smaller market cap segments outperforming the larger ones. In the Russell 2000 Value, stocks with a market cap below $500 million returned 34.6%, while those with a market cap greater than $1.5 billion returned 30.1%. Similar to the fourth quarter, stocks in our strategy with lower PE’s performed significantly better than those with higher PE’s. The strategy also benefited from having a higher weight in low-PE stocks relative to the Index.
From a sector standpoint, the strategy’s stock selection in Consumer Discretionary and Consumer Staples contributed 280 basis points of return versus the Index. However, poor stock selection in Industrials and Materials detracted 390 basis points versus the Index. The lack of Utilities and Telecom exposure within the strategy was a tailwind, resulting in approximately 50 basis points of excess return during the year.
Industrials was the highest weighted sector in the strategy at 25.5% and had the greatest overweight compared to the Index at 12.8%. The strategy’s holdings in the sector returned 23.7% for the year, compared to a 32.7% gain in the Index. The greatest contributor to performance in the sector was Barrett Business Services (“BBSI”), with its shares returning 50.6% for the year (see the Fourth Quarter 2016 narrative for highlights on BBSI).
Textainer Group (“TGH”), the world’s second largest shipping container lessor, was the greatest detractor to returns in the Industrials sector, with its shares down 44.8% for the year. TGH continued to see weakness in demand for leased containers through the back half of 2016. In addition, Chinese steel prices remained low in the first quarter, causing sustained pressure on new and used container prices. The Hanjin Shipping bankruptcy in August furthered the consternation in Textainer shares and the Company announced that it would be realizing small losses as a result. We continue to find the valuation of Textainer attractive as expectations project a gloomy outlook for container economics long into the future. The tightening supply of containers and long-term trade growth outlook also give us optimism.
Information Technology was the second highest weighted sector in the strategy at 21.8%, and second greatest overweight compared to the Index at 10.2%. The strategy’s holdings in this sector increased 29.3% for the year, compared to a 41.0% gain in the Index. Ultra Clean Holdings (“UCTT”) was the greatest contributor to returns, with the shares returning 89.5% for the year (please see the Fourth Quarter 2016 narrative for more information on this security).
Computer Task Group (“CTG”) was the greatest detractor to returns in the Information Technology sector, with its shares down 34.0% for the year. CTG, an information technology consulting and staffing company, has struggled with declining revenues in each of its segments as new management attempts to execute a turnaround. Recent investments in business development in the staffing segment will hopefully return the company to a growth trajectory. In the meantime, a clean balance sheet and modest cash flow generation are providing some downside protection.
Financials was the third highest weighted sector at 20.7%, compared to 29.9% in the Index. The strategy’s holdings in this sector returned 41.8% during the period, compared to a 37.3% gain in the Index. BofI Holding (“BOFI”) was the greatest contributor to returns in the sector, with the shares returning 35.6% for the year. BOFI, an internet bank based in San Diego, CA, has been engaged in a legal battle with a former employee who has made numerous sensational accusations against the company and the management team. The bank was also the subject of numerous articles by short sellers attempting to drive down the price of its stock. Despite these negative events, favorable legal rulings, continued excellent credit quality, solid profitability, and the surprise outcome of the election have helped send the stock to recent highs.
Third Point Reinsurance (“TPRE”) was the greatest detractor to returns in the Financials sector, with its shares down 13.9% during the year (please see the Fourth Quarter 2016 narrative for more information on this security.)
As always, we continue to search for companies that demonstrate an ability to earn a fair return on capital. We welcome any questions or comments you may have, and thank you for your continued support.
Sincerely,
Pacific Ridge Capital Partners
*Returns are preliminary
Note: Sector weights for the strategy and index are the average for the period

Disclosures
Pacific Ridge Capital Partners, LLC (“Pacific Ridge”, “PRCP”, or “the Firm”) is a 100% employee owned investment advisor registered with the Securities and Exchange Commission under the Investment Advisors Act of 1940. The Firm was established in June 2010, and has one office located in Lake Oswego, Oregon. Pacific Ridge claims compliance with the Global Investment Performance Standards (GIPS®) and has prepared and presented this report in compliance with the GIPS standards. PRCP has been independently verified for the periods June 10, 2010 through September 30, 2016. Verification assesses whether (1) the Firm has complied with all the composite construction requirements of the GIPS standards on a firm-wide basis and (2) the Firm’s policies and procedures are designed to calculate and present performance in compliance with the GIPS standards. The Small Cap Value composite has been examined for the periods August 1, 2010 through September 30, 2016. The verification and performance examination reports are available upon request.
The Small Cap Value composite was created on August 1, 2010. The Small Cap Value composite comprises fully discretionary portfolios managed by the Firm invested primarily in an equity portfolio of small companies with market capitalizations similar to those found in the bottom three-quarters of the Russell 2000 Index. The strategy ascribes to a disciplined bottom-up fundamental selection process with an emphasis given to the cash flow generating capabilities of a company. The strategy’s objective is to outperform the Russell 2000 Value Index which is used as our benchmark. Eligible portfolios must be managed for a full calendar month prior to inclusion in the Small Cap Value composite. Composite dispersion is measured using an asset weighted standard deviation of returns of the portfolios. Returns and asset values are stated in US dollars.
The Russell 2000 Value Index measures the performance of the Russell 2000 companies with lower price-to-book ratios and lower forecasted growth values. For comparison purposes, the index is fully invested, which includes the reinvestment of income. The return for the index does not include any transaction costs, management fees or other costs.
Sources: Pacific Ridge; FactSet Research Systems (“FactSet”); and Russell Investment Group (“Russell”) who is the source and owner of the Russell Index data.
Returns for the Small Cap Value composite are presented gross and net of management fees and other expenses and includes realized and unrealized gains and losses, cash and cash equivalents and related interest income, and accrued based dividends. Net returns are calculated by deducting the highest annual management fee of 1.00% from the quarterly gross composite return. All returns are calculated after the deduction of the actual trading expenses incurred during the period.
The management fee is a flat rate of 1.00%.
The portfolio characteristics, sector weightings and attribution analysis for the Small Cap Value composite are based on a representative account within the strategy. The representative account statistics are shown as supplemental information. The Firm maintains a complete list and description of composites, policies for valuing portfolios, calculating performance, and preparing compliant presentations which are available upon request by contacting Peter Trumbo, Chief Compliance Officer at (503) 886-8972 or Peter.Trumbo@PacificRidgeCapital.com.
Top 5 and Bottom 5 Performing Securities represent those security holdings that had the largest positive and negative total contribution to the portfolio return. Top 3 and Bottom 3 Economic Sectors represent those sectors that had the largest positive and negative total contribution to the portfolio return.
In order to maintain consistency when comparing the Small Cap Value strategy to the Russell benchmark, the Firm utilizes FactSet’s outlier methodology calculations which provide a comparable portfolio characteristic calculation methodology as Russell applies to its indices.
The information provided should not be considered a recommendation to purchase or sell any particular security. There is no assurance that any securities discussed herein will remain in our strategy at the time you receive this report or that securities sold have not been repurchased. It should not be assumed that any of the holdings discussed herein were or will be profitable or that the investment recommendations or decisions we make in the future will be profitable or will equal the investment performance of the securities discussed herein. Past performance is no guarantee of future results.
Although the statements of fact and data in this report have been obtained from, and are based upon, sources that the Firm believes to be reliable, we do not guarantee their accuracy, and any such information may be incomplete or condensed. All opinions included in this report constitute the Firm’s judgment as of the date of this report and are subject to change without notice. This report is for informational purposes only and is not intended as an offer or solicitation with respect to the purchase or sale of any security.