

Q1'18 Small Cap Value Strategy
The Pacific Ridge Capital Partners (“PRCP”) Small Cap Value strategy fell 1.8%† for the first quarter of 2018, ahead of the 2.6% decline in the Russell 2000® Value Index (“Index”). Over the trailing one-, three-, and five-year periods, the strategy returned 4.0%†, 8.1%†and 12.7%† (annualized), respectively, compared to the Index returns of 5.1%, 7.9%, 10.0%. Since inception on August 1, 2010, the strategy has returned 13.5%† annually versus 11.9% for the Index.
Much of the recent market turbulence originates from concerns over the possibility of a trade war with China. The proposed policy changes are generally disappointing, with little historical evidence that tariffs provide a net economic benefit over the long-term. The administration has legitimate reasons to be frustrated with China’s trade policy. They often make it difficult for US companies to compete there. Additionally, China is notorious for having little regard for intellectual property rights of foreign companies. On the other hand, the United States has benefited tremendously from trade with China over the past several decades, both as a source of low cost labor, and as a rapidly growing market for our goods and services. Addressing the challenges of trading with China, while trying to create a level playing field, is an issue that multiple administrations have struggled with in the past.
In the near term, there is likely to be little impact to our investment decision making from these trade discussions. We think steel and aluminum producers are in the best position to benefit initially, although we do not currently have a position in either of these industries. Less competition at the margin in these industries will likely lead to increased producer profits, while the costs will be borne broadly across all sectors of the economy as higher inflation gets passed down to the end consumer. Initial commentary from management teams in the Industrials sector suggests that this is a minor issue given strong economic demand, and that increased costs will be passed along, though with a one-to-two quarter lag. That said, a sustained trade war with additional tariffs would likely lead to higher inflation, an increased pace of rate increases from the Fed and slower economic growth.
Initial retaliation from China seems limited to food products and finished steel, areas where we have little exposure. Given that our strategies focus on smaller market capitalization companies that have less exposure to international trade, we would expect our holdings to be less impacted by the implementation of additional tariffs or trade restrictions when compared to mid- and large-cap companies. As the administration’s policies are still in the early stages of being implemented, it is difficult to forecast how this will ultimately play out in the intermediate- to long-term. As mentioned earlier, our concern lies in a continued escalation of trade tensions that could have a materially negative impact on economic growth.

First Quarter 2018
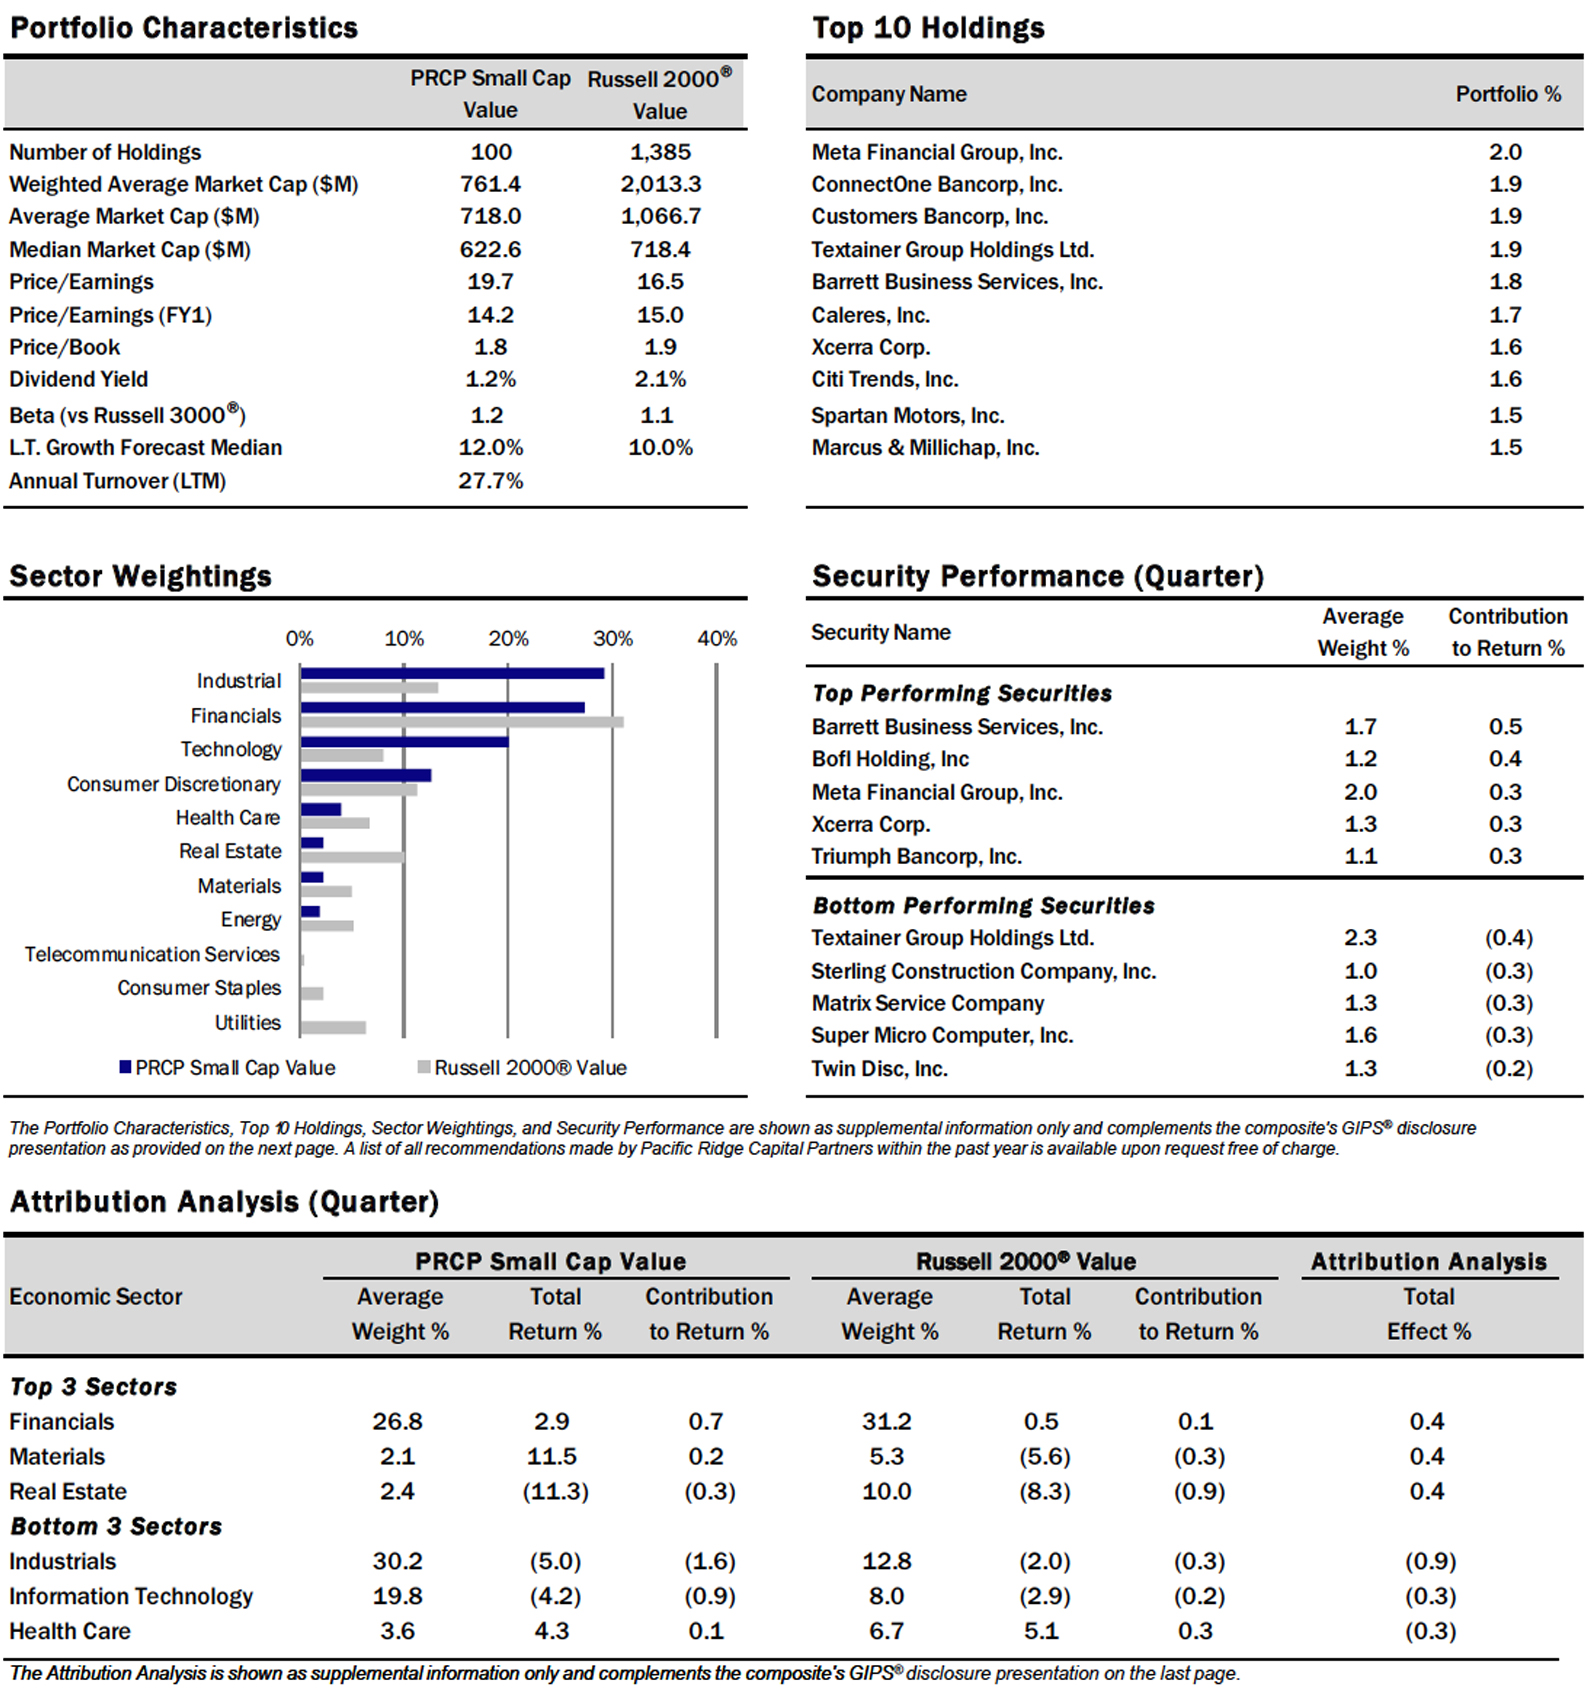
The Small Cap Value strategy outperformed the Russell 2000 Value Index by approximately 80basis points for the quarter. There was a modest size bias in the Index, as those stocks with a market cap less than $1 billion fell 0.6% during the quarter, while those with a market cap greater than $1 billion declined 3.4%. This small size bias provided a slight tailwind to the strategy, given that companies with market caps over $1 billion comprised 74.4% of the Index, compared to just 33.1% for the strategy.
From a sector standpoint, the strategy’s performance in Financials and Materials contributed nearly 90 basis points of excess return versus the Index. However, poor performance in Industrials detracted 90 basis points versus the Index. In a reversal from the prior quarter, lower beta stocks performed better in both the Index and the strategy, though the impact on returns was negligible given similar weights for both the strategy and the Index by beta quintile.
Industrials remained the highest weighted sector in the strategy at 30.2% and had the greatest overweight compared to the Index at 12.8%. The strategy’s holdings in the sector fell 5.0% in the period, compared to a decline of 2.0% in the Index. The greatest contributor to performance was Barrett Business Services (“BBSI”), with its shares returning 28.9% for the quarter. BBSI, a leading human resource management and staff leasing provider, rallied after reporting strong fourth quarter earnings and having further resolved previous reserving and filing issues. The company experienced solid revenue growth over the past several years and it is expected to continue expanding in 2018 as it steadily wins new clients.
Textainer Group Holdings (“TGH”) was the greatest detractor to returns in the Industrials sector, with its shares down 21.2% for the quarter. TGH, the world’s second largest shipping container lessor, sold off in February when they reported earnings. Though their numbers were good, they referenced increased competition and capital flowing into new containers. The reaction by the market in punishing TGH’s stock price seemed excessive, as there was no mention of irrational competition or rates falling to levels seen several years ago.
The Financials sector was the second highest weighted sector in the strategy at 26.8%, compared to the Index at 31.2%. The strategy’s holdings in this sector returned 2.9% during the period, compared to a gain of 0.5% in the Index. BofI Holding (“BOFI”) was the greatest contributor to returns in the sector, with the shares returning 34.7% for the quarter. BOFI, an internet bank based in San Diego, CA, rallied during the quarter as earnings expectations were steadily revised higher. Over the past few years, the company has battled attacks from short-sellers, as well as lawsuits alleging various financial indiscretions. Those attacks appear to have fizzled out, lawsuits against the company have been dismissed and the company continues to perform well. Because BOFI’s stock price more than doubled over the previous 18 months and has surpassed our price target, we exited our position during the quarter.
Heritage Insurance Holdings (“HRTG”) was the greatest detractor to returns in the Financials sector, with shares down 15.6% in the quarter. HRTG, a property and casualty insurer based in Florida, rallied more than 80% off its lows last summer before giving back some of its gains earlier this year. The company recently completed the acquisition of Narragansett Bay Insurance, who provides insurance in states along the Eastern seaboard. This acquisition lessens HRTG’s overall exposure to the Florida homeowners’ insurance market, as well as to single-event catastrophes. The combination of these two underwriters will also lead to significant reinsurance savings and earnings growth.
Information Technology was the third highest weighted sector in the strategy at 19.8% and had the second greatest overweight compared to the Index at 8.0%. The strategy’s holdings in this sector fell 4.2% during the period, compared to a loss of 2.9% in the Index. Xcerra Corporation (“XCRA”) was the greatest contributor to returns in the sector, with the shares returning 19.0% in the quarter. XCRA, a manufacturer of semiconductor and electronics manufacturing test equipment, agreed last year to be acquired by a Chinese investment partnership. Meanwhile, XCRA continued its strong revenue growth and expanding margins. Ultimately, the acquisition was terminated when it became clear that the deal would not gain regulatory approval. The stock surged when shareholders became the beneficiaries of that growth.
Super Micro Computer (“SMCI”) was the greatest detractor to returns in the sector, with the shares down 18.8% for the quarter. SMCI, a maker of specialized application-specific server solutions, has been delinquent in their regulatory filings since last year. The stock sold off in February when they missed another deadline and announced several senior level personnel changes. However, the company fundamentals still look strong and one analyst increased their price target in recent weeks.
As always, we continue to search for companies that demonstrate an ability to earn a fair return on capital. We welcome any questions or comments you may have and thank you for your continued support.
Sincerely,
Pacific Ridge Capital Partners
†Returns are preliminary
Note: Sector weights for the strategy and Index are the average for the period

Disclosures
Pacific Ridge Capital Partners, LLC (“Pacific Ridge”, “PRCP”, or “the Firm”) is a 100% employee owned investment advisor registered with the Securities and Exchange Commission under the Investment Advisors Act of 1940. The Firm was established in June 2010, and has one office located in Lake Oswego, Oregon. Pacific Ridge claims compliance with the Global Investment Performance Standards (GIPS®) and has prepared and presented this report in compliance with the GIPS standards. PRCP has been independently verified for the periods June 10, 2010 through December 31, 2017. Verification assesses whether (1) the Firm has complied with all the composite construction requirements of the GIPS standards on a firm-wide basis and (2) the Firm’s policies and procedures are designed to calculate and present performance in compliance with the GIPS standards. The Small Cap Value composite has been examined for the periods August 1, 2010 through December31, 2017. The verification and performance examination reports are available upon request.
The Small Cap Value composite was created on August 1, 2010. The Small Cap Value composite comprises fully discretionary portfolios managed by the Firm invested primarily in an equity portfolio of small companies with market capitalizations similar to those found in the bottom three-quarters of the Russell 2000®Index. The strategy ascribes to a disciplined bottom-up fundamental selection process with an emphasis given to the cash flow generating capabilities of a company. The strategy’s objective is to outperform the Russell 2000®Value Index which is used as our benchmark. Eligible portfolios must be managed for a full calendar month prior to inclusion in the Small Cap Value composite. Composite dispersion is measured using an asset weighted standard deviation of returns of the portfolios. Returns and asset values are stated in US dollars.
The Russell 2000®Value Index measures the performance of the Russell 2000 companies with lower price-to-book ratios and lower forecasted growth values. For comparison purposes, the index is fully invested, which includes the reinvestment of income. The return for the index does not include any transaction costs, management fees or other costs.
Sources: Pacific Ridge; FactSet Research Systems (“FactSet”); and Russell Investment Group (“Russell”) who is the source and owner of the Russell Index data.
Returns for the Small Cap Value composite are presented gross and net of management fees and other expenses and includes realized and unrealized gains and losses, cash and cash equivalents and related interest income, and accrued based dividends. Net returns are calculated by deducting the highest annual management fee of 1.00% from the quarterly gross composite return. All returns are calculated after the deduction of the actual trading expenses incurred during the period.
The management fee is a flat rate of 1.00%.
The portfolio characteristics, sector weightings and attribution analysis for the Small Cap Value composite are based on a representative account within the strategy. The representative account statistics are shown as supplemental information. The Firm maintains a complete list and description of composites, policies for valuing portfolios, calculating performance, and preparing compliant presentations which are available upon request by contacting Peter Trumbo, Chief Compliance Officer at (503) 886-8972 or Peter.Trumbo@PacificRidgeCapital.com.
Top 5 and Bottom 5 Performing Securities represent those security holdings that had the largest positive and negative total contribution to the portfolio return. Top 3 and Bottom 3 Economic Sectors represent those sectors that had the largest positive and negative total contribution to the portfolio return.
In order to maintain consistency when comparing the Small Cap Value strategy to the Russell benchmark, the Firm utilizes FactSet’s outlier methodology calculations which provide a comparable portfolio characteristic calculation methodology as Russell applies to its indices.
The information provided should not be considered a recommendation to purchase or sell any particular security. There is no assurance that any securities discussed herein will remain in our strategy at the time you receive this report or that securities sold have not been repurchased. It should not be assumed that any of the holdings discussed herein were or will be profitable or that the investment recommendations or decisions we make in the future will be profitable or will equal the investment performance of the securities discussed herein. Past performance is no guarantee of future results.
Although the statements of fact and data in this report have been obtained from, and are based upon, sources that the Firm believes to be reliable, we do not guarantee their accuracy, and any such information may be incomplete or condensed. All opinions included in this report constitute the Firm’s judgment as of the date of this report and are subject to change without notice. This report is for informational purposes only and is not intended as an offer or solicitation with respect to the purchase or sale of any security.